Models of tension cracks at Wallaby, a lode gold deposit in Western Australia. This section illustrates the process of model development towards determining the conditions and geometry for tensile cracking layer during horizontal shortening, in the presence of pressurized pore fluids. Models demonstrate that horizontal cracks develop when a discharge is added to the base of the model, increasing pore pressure above lithostatic. Simultaneous vertical and horizontal cracks develop at high discharge values.
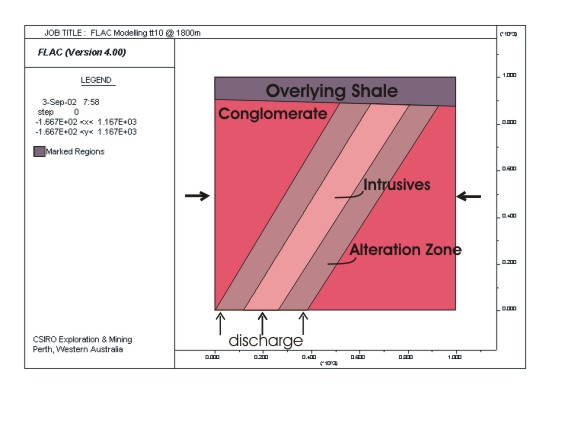
The model consists of four layers: an overlying shale, a conglomerate surrounding an alteration zone consisting of an external alteration and an internal zone with numerous intrusive dykes. These two alteration zones are referred to as the "Dipping altered layer" and have the same plastic parameters and slightly different elastic modulii. The top of all models are at a depth of 1800m and not at the surface. This has implications for lithostatic and hydrostatic pressures within the model. All models shown below have a depict deformation of this initial geometry after 20% lateral shortening. With the exception of the first model, they are arranged in a logical progression, from simplest to most complex.
 |
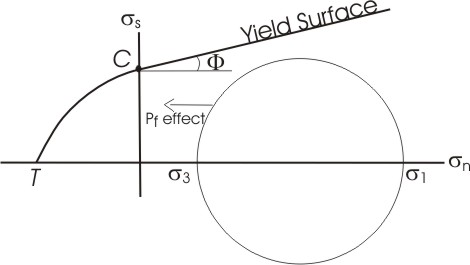 |
| Mohr space: shear vs
normal stress. The yield surface is defined by the tensile strength (T),
cohesion (C)
and friction angle (F |
SUMMARY OF RESULTS
All results summarized in Tables 1, 2, and 3 are fully discussed below, including links to material properties used, the Flac input file and other pages.
Table 1. The effect of increased pore pressure. At low pore pressure the rock yields on shear planes. As pore pressure increases, there is first the development of horizontal tension cracks (tt10), followed by the contemporaneous development of horizontal and vertical tension cracks (tt24). In tt24 there is also important cracks along the margins of the competent layer and enhanced thrusting of the block to the left. Notice that all these models used R, the ratio between fluid flow and deformation rates, of 10. This implies that significant deformation is fast compared to the rate of fluid flow and deformation related dilation controls fluid flow into shear zones and cracks. See Table 3 for variation of R.
 tt3 no fluids |
 tt43 hydrost. |
 tt23 lithost. |
 tt10 lithost. & discharge dis'=35.1 |
 tt11 = tt10 low T - high Coh |
 tt24 lithost. & discharge dis'=70.2 |
Summary table 2. The effect of varying pore pressure on differential stress. Differential stress goes down from blue tones at the top of the dipping layer, to green, yellow and red in the lower parts of the model, where tension cracking is taking place (see Table 1). Note that differential stress is lower (red colour) in tt24 where the discharge is higher.
 tt10 R=10 |
 tt24 twice the discharge at the base compared to tt10. |
Summary table 3. The effect of varying R, the ratio between fluid flow and deformation rates. The flow goes from strongly dominated by dilational deformation on the left, to dominated by regional lithostatic pore pressure on the right. The middle frame depicts an intermediate state where both dilation and lithostatic pore pressure gradients play a role driving the fluid both upwards and sideways along the tension cracks.
 tt10. R=10 |
 tt30. R=25 |
 tt26. R=50 |
Click here to see Film (missing)
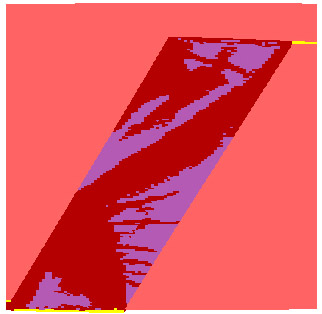
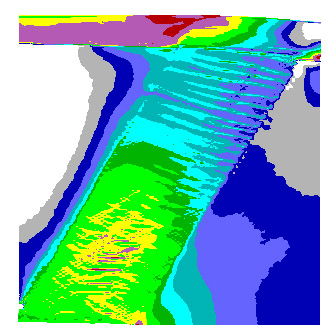
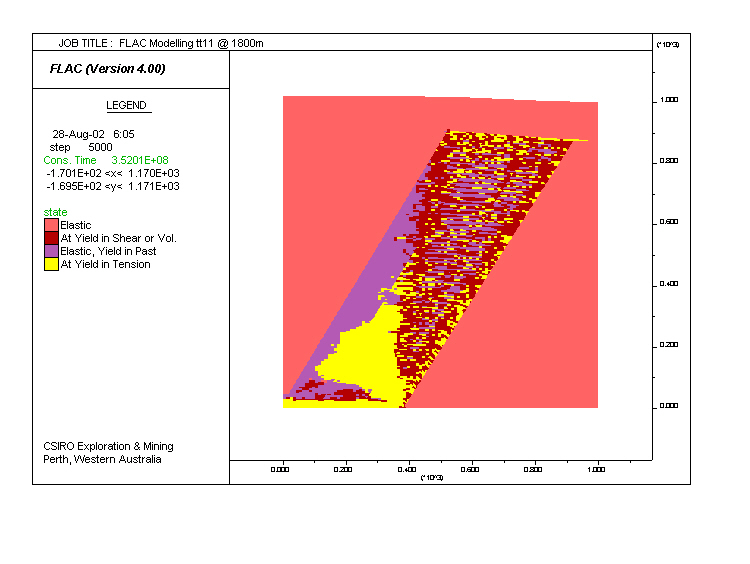
Reference Model tt10. Tension cracks (in yellow) developed in a dipping layer, saturated with fluid and having fluid flow into its base. The system simulates the alteration zone at Wallaby. Dark red areas are yielding under shear strain, and areas in the two tones of pink are undergoing elastic deformation.

|
Model tt1. Exploratory model aimed at establishing the elasto-plastic parameters that would lead to fracturing of the dipping layer. Fluid saturation was set to zero, so that the results are for a dry rock. The results indicate that the choice of parameters was inappropriate because it led to the simultaneous fracturing of both layers. Note the development of conjugate shear zones.
 |
|
| See tt3 below for Mohr circle | |
| Material properties FLAC input file | |
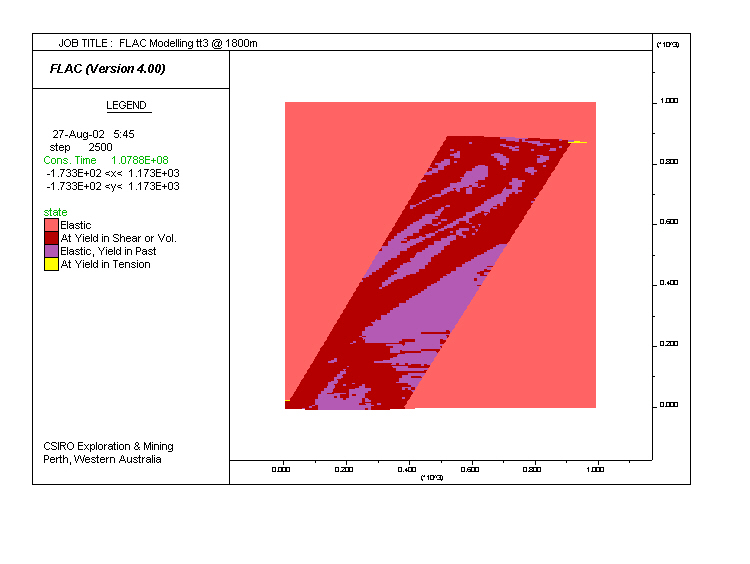
Model tt3. Same as tt1 (dry), but with elasto-plastic parameters of the country rock increased so as to make it stronger. Plastic deformation is now restricted to the dipping layer of altered and intrusive rocks.
 |
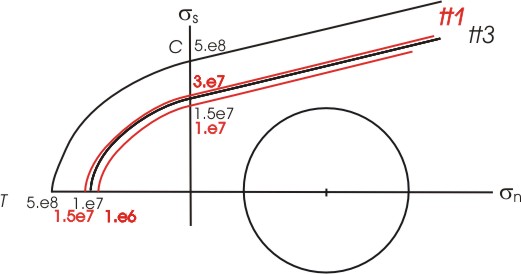 |
| Yield surfaces for both the dipping altered layer and the country rock in models tt1 (in red) and tt3 (in black). The relatively large differences between the curves in tt3 resulted in the significant differences in shearing between the two regions. |
| Material properties FLAC input file |
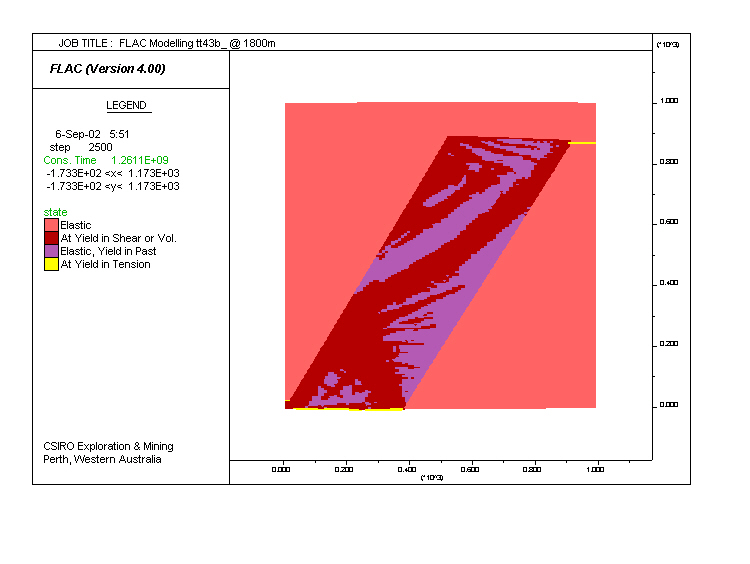
Model tt43. Same as tt3, but fluid saturation was set to 1 (fully saturated) and initial pore pressure was set to hydrostatic. The results are similar to tt3. Note the variation in dip of the shear zones in red.
|
| Fluid flow plot |
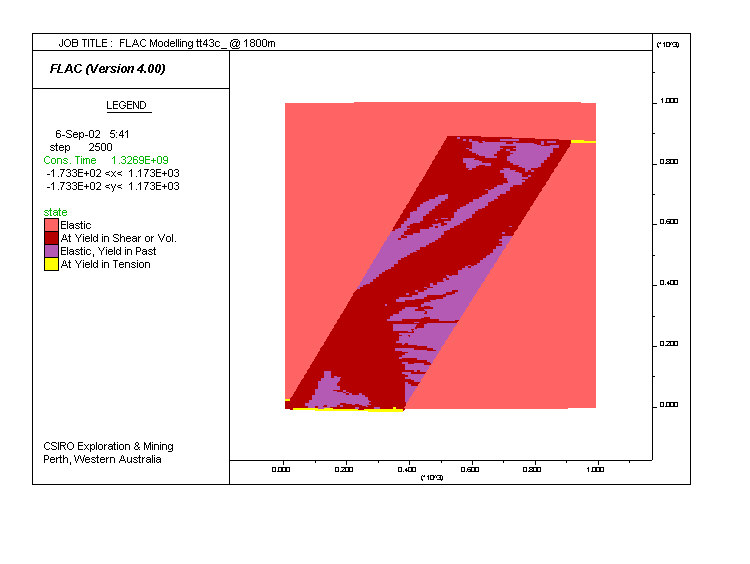
Model tt23. Same as tt43, but pore pressure was set to lithostatic, further weakening the rock. There is relatively little difference between the two. Here, the block to the left is being thrust over the right-hand-side, as a result of the weakening of the dipping layer.
|
| Fluid flow plots Material properties FLAC input file |
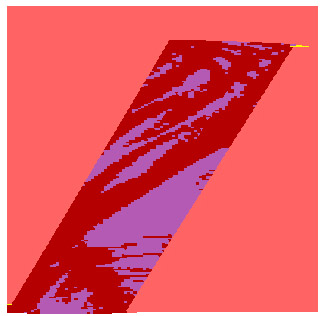
Model tt10 (as above) Same as tt23, but a discharge was added to the base of the dipping layer, simulating upward fluid flow. The discharge causes increased pore pressure at the lower part of the model and the development of tensile cracks shown in yellow. Note the coincidence between regions undergoing tension cracks and elastic deformation (pink) within the altered layer. This is because the tension cracks released the accumulated stress in the area (see also tt24). In this model fluid flow downwards towards the region yielding under tension. By decreasing the rate of deformation in relation to fluid flow, the region yielding under tension involves the entire layer (see tt26 below).
In an early model, discharge was set too high in comparison to permeability, leading to a rapid volume increase at the base of the model, large expansion of individual grid zones, and eventual disruption of the calculations. Click here to see the grid in this failed calculation.
|
|
| Fluid flow plot Material properties FLAC input file |
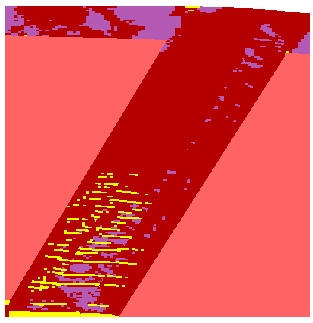
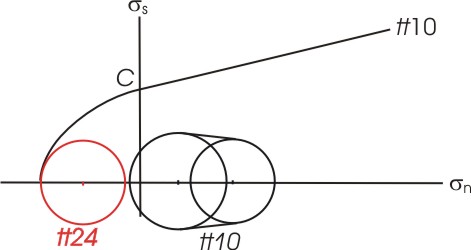
Model tt11. Same as tt10, but the tensile strength T was decreased and the cohesion C increased.
|
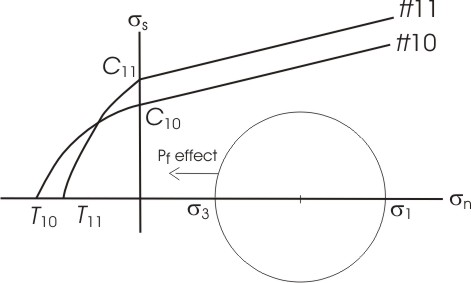 |
| Schematic yield surfaces for models tt10 and tt11. The decrease in T and increase in C in the alteration zone in tt11 implies that tensile fractures are favoured and shear fractures are inhibited. The results confirm the prediction. |
| Material properties FLAC input file |
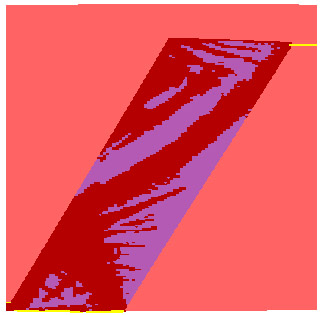
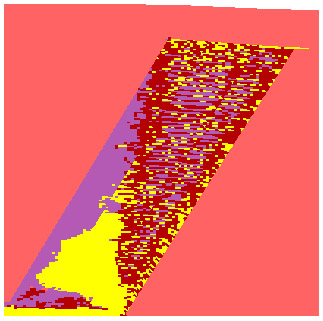
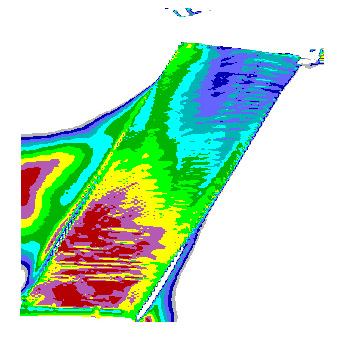
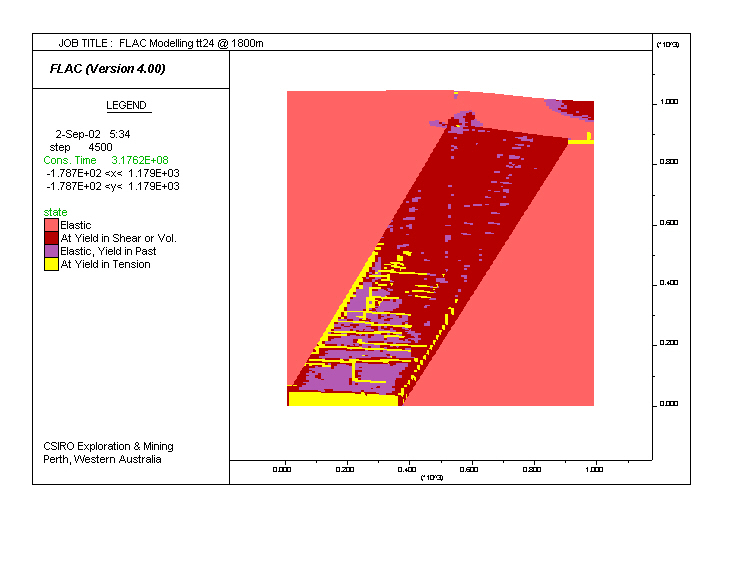
Model tt24. Same as tt10, but twice the discharge (dis) is applied to the base. Development of horizontal and vertical tension cracks, which control fluid flow. Significant thrusting to the left along the left-hand-side margin of the altered zone is indicated by the development of topography.
FLAC models use dimensional variables such as velocity in m/s etc. Sometimes, life is simpler by thinking in dimensionless terms. Click here for a discussion of dimensionless discharge and its significance.
|
 |
| Increased discharge
implies lower effective mean stress after the same amount of loading in
tt24
compared to tt10.
This leads to early development of horizontal tension cracks. Vertical
tension gashes develop as a result of swaps between s |
| Material properties FLAC input file |
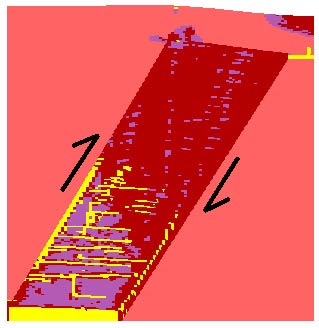
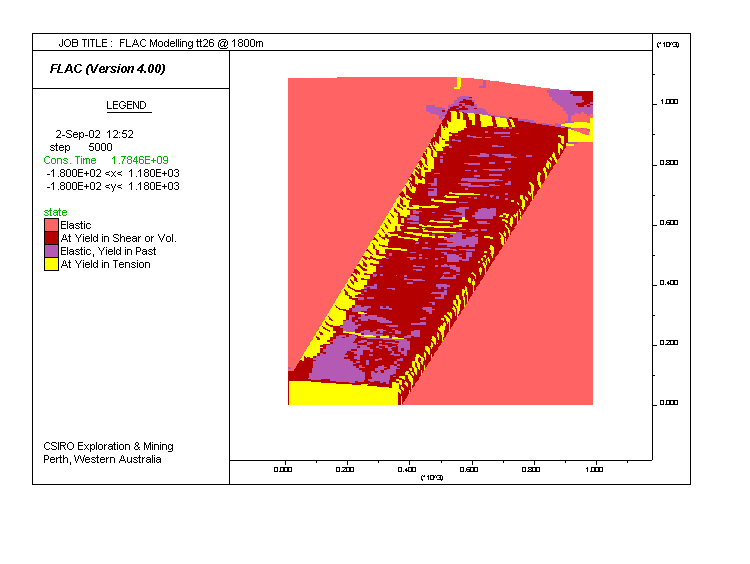
Model tt26. Same as tt10, but with a fluid flow rate compared to the shortening rate accelerated by 5. This increases the pore pressure throughout the entire dipping altered layer, and leads to well developed tensile cracks andthe development of sinusoidal tension gashes at the margins of the dipping layer. Because the entire layer is weakened, compared to tt10, there is a significant thrusting of the left block towards the right as indicated by the topography. Modifying the ratios between fluid flow and deformation rates lead to very significant differences in flow through the altered layer. Click here to see the difference
|
| Fluid flow plot Material properties FLAC input file |
CONCLUSION
The models demonstrate the role of fluid pressure during deformation. Horizontal cracks develop when a discharge is added to the base of the model, thus increasing pore pressure above lithostatic. Vertical and horizontal cracks develop at high discharge values. Thrusting becomes increasingly more important as fluid pressure increases.
The angle of the alteration zone is a very important variable which was not explored here. The increased importance of trusting which was observed in the last three models would have taken place at lower pore pressures if the angle of the zone was gentler.