The models show that upon release of pressurized fluid to the base of the model, simulating the release of magmatic fluids, leads to rapid pore pressure increase at the base leading to yielding in that area. This basal yielding leads to stress release in the upper part inhibiting yielding. With time, however, overall fluid pressure gradually increases, leading to yielding of the entire model. When the influx is turned off, simulating the end of fluid exsolution from a crystallizing magma body, yielding everywhere across the model is inhibited because pore pressures have decreased everywhere and the crust becomes consequently stronger. Upon further deformation and stress loading, yielding resumesdownwards from the top. Throughout the calculation, fluids migrate upwards.
The model focuses on the upper crust, with the top at the surface and the base at 10 km. It comprises of a single elasto-plastic rock, and the initial pore pressure is hydrostatic and all boundaries, except the top, are impermeable. The top has a pore pressure fixed at atmospheric pressures at the surface of 1e5 Pa. A constant horizontal velocity is applied to the two vertical boundaries, and at some point during deformation, a fluid influx (discharge, dis) is initiated at the base of the model, and turned off after a number of steps.
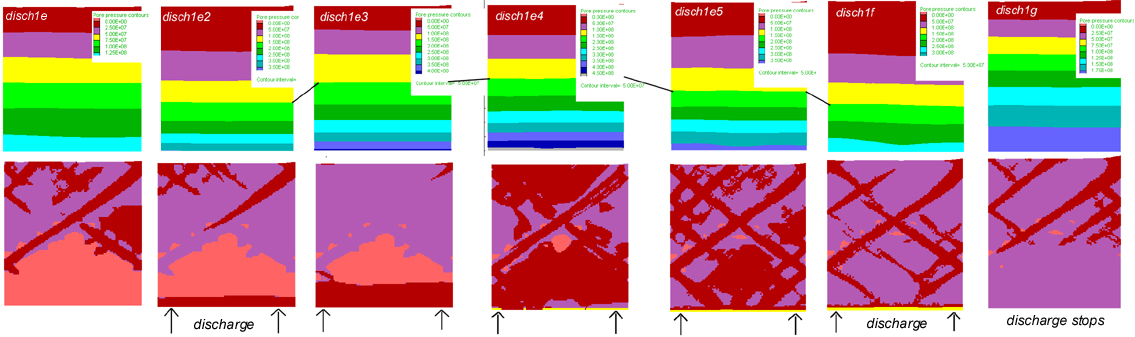
The figure below illustrates the evolution of the system. A movie can be seen by clicking on the figure. The left-hand side figure shows the state of the crust after some deformation, before any fluid discharge at the base. The upper half of the model is undergoing yielding (red zones) or has undergone yielding (purple areas). When discharge starts, the base of the model yields, inhibiting yielding in the upper half through releasing the loaded elastic stresses at the base. As pore pressure increases, with continued fluid influx, the entire crust weakens and yields. When fluid influx stops, there is first a short phase where the entire model crust stops yielding. Gradually, as stresses are loaded, yielding starts again at the top, and migrates downwards.
During early yielding, with no fluid influx at the base, fluid flows both upwards and downwards into zones of dilation, normally at intersections of yielding zones. When the discharge of pressurized fluids to the base starts, fluids everywhere tend to migrate upwards, preferentially along zones of yielding, because of their dilation angle.
Input File