The model consists of three layers, an low permeability layer embedded within two more permeable layers, and a weaker, high permeability shear zone cutting the low permeability layer (in FLAC terminology this shear zone is given "ubiquitous joints" state). This set of models is designed to investigate fluid flow through and conditions for fluid pumping.
In these models, three different variables may influence the flow of fluids through the shear zone during the calculations:
a) Dilation angle (Psi), which controls the increase in porosity as a result of shearing. As the shear zone is strained, dilation/porosity increases. Dilation angle of the shear zone was constant and equal to 2o.
b) State function, which changes permeability as a function of state. In FLAC permeability is a given of the problem and not a function of porosity, as in nature. A state function was created that causes the permeability in the shear zone to increase by one order of magnitude when it yields, and then drop back when it stops yielding. This function has a step shape.
c) VSI function, which changes permeability as a function of volume strain increment (VSI). This function causes permeability to decrease when rock volume decreases (porosity loss), or to increase when volume increases.
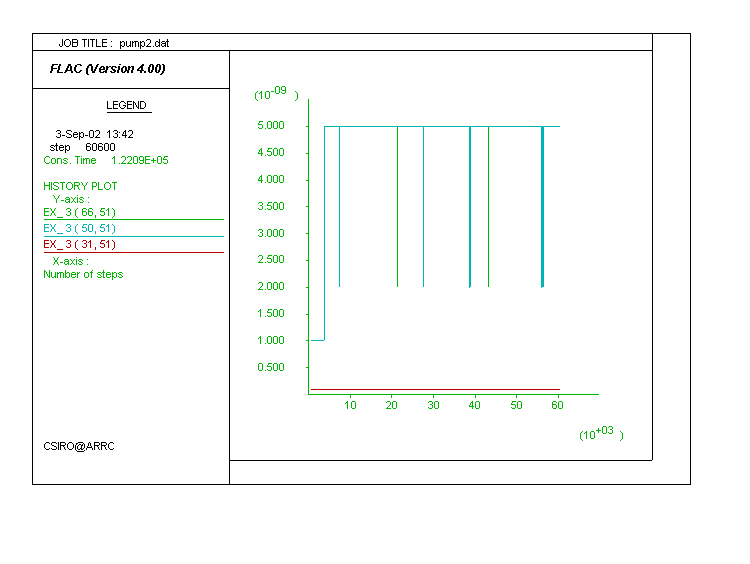
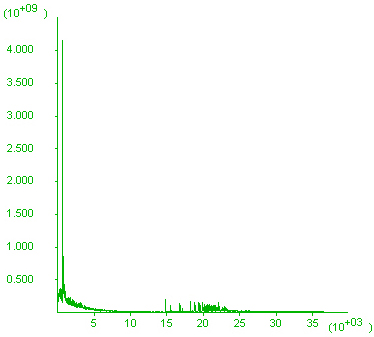
A typical permeability history including both the VSI and state functions is shown below. Permeability (y-axis) starts by gradually decreasing due to the VSI function and related porosity loss. When the shear zone yields, permeability within it increases by a factor of 5 (state function) and decreases again to twice the initial value as the zone stops yielding, leading to the downwards spikes.
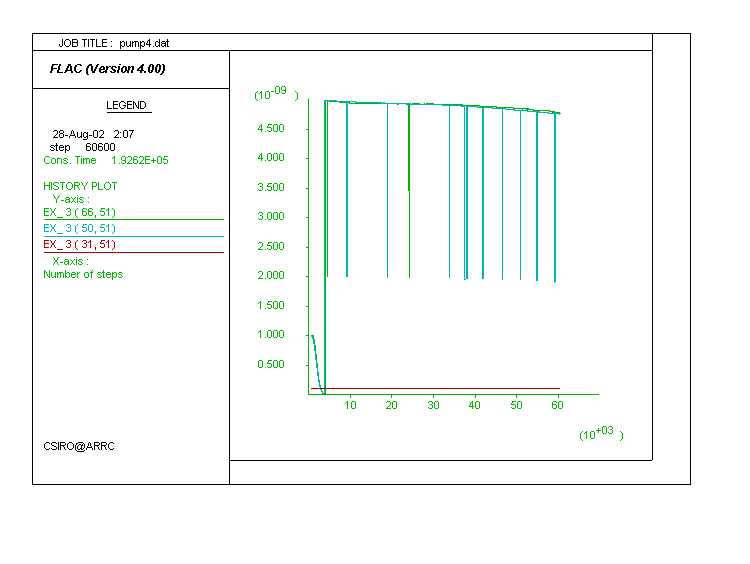
|
The reference model (Pump1) is the simplest one. Only the effects of shearing and dilation angle (2o) are considered. In this case permeability within the shear zone is constant throughout the calculations.
The diagram below shows the Volume Strain Increment (VSI) within and around the shear zone. Regions of dilation (positive VSI) dvelop during horizontal shortening and shearing within the shear zone. Shearing leads to horizontal dilation planes (wings) asymmetrically distributed at the terminations of the shear zone.
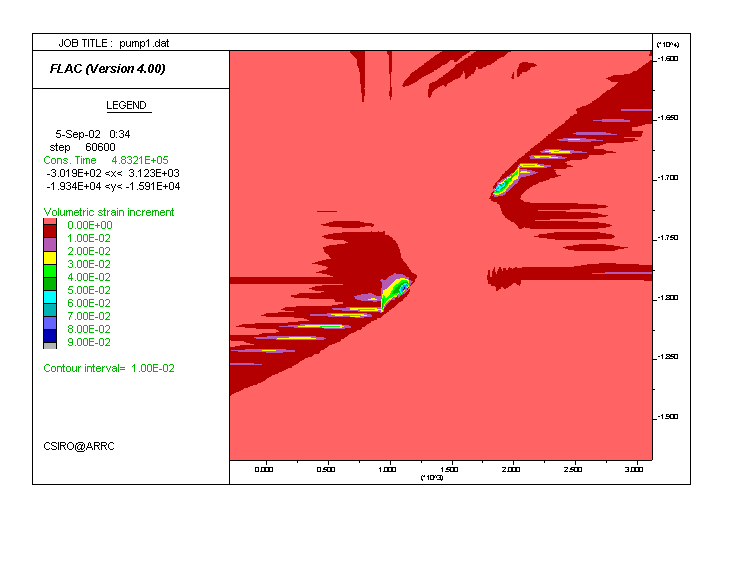
|
| Material properties |
| FLAC input file |
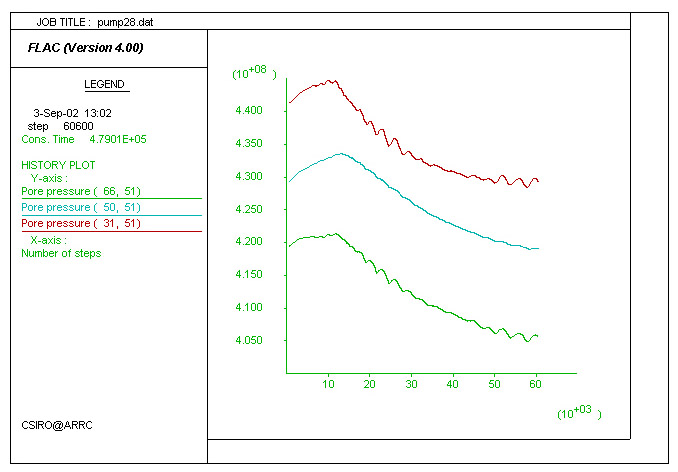
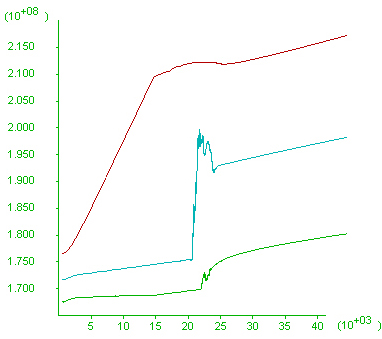
Pore pressure history. This diagram plots the pore pressure history of three points in the model: one point above the shear zone (green line, low pore pressure), one within (blue line) and one below (red line, high pore pressure) the shear zone. Fluctuations in pore pressure are associated with intermittent slip on the shear zone and dilation (better depicted in models below) . Another calculation (right-hand-side, Pump28), with decreased dilation angle, resulted in a decrease of the amplitude of the pore pressure variation.
 |
 |
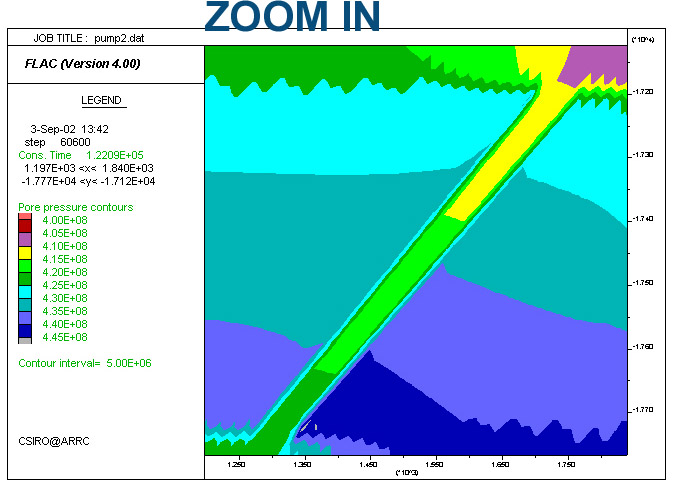
Model Pump2. Same as Pump1, but permeability varies with state, increasing by a factor of 5 when the shear zone yields and decreasing to a factor of 2 when it stops yielding.
|
| Material properties |
| FLAC input file |
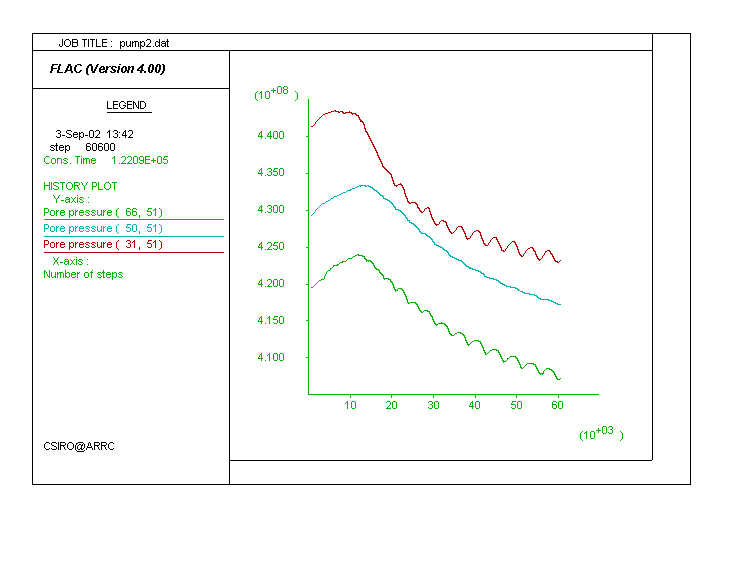
Pore pressure history. The plot is very similar to that in Pump1 but hides significant changes in the fluid velocity through the shear zone. The five-fold increase in permeability allows initially a similar fluid velocity increase. However, because of the enhanced communication between zones of high and low pore pressure there is rapid decrease in the pore pressure gradient driving and consequently a decrease in velocity. This is further explored below.
|
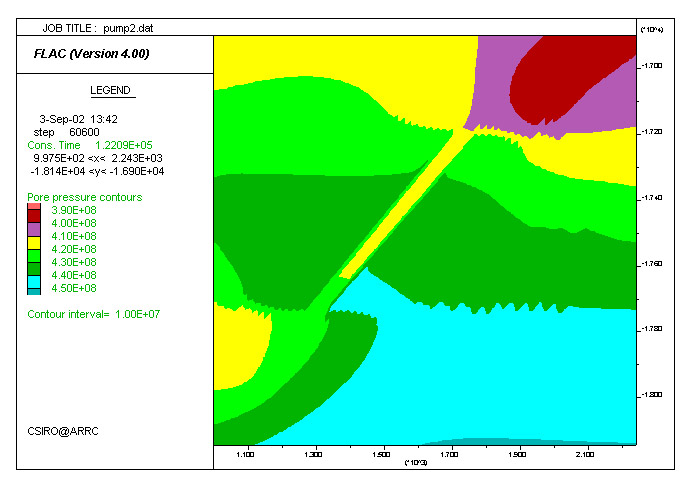
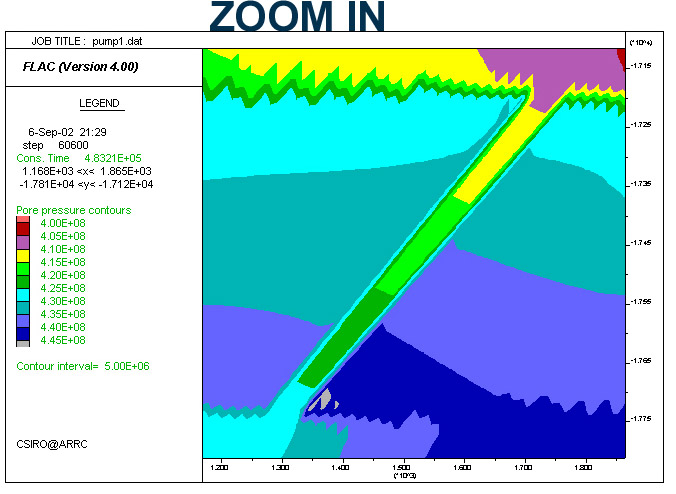
Comparison between the pore pressure distribution of models Pump1 (low permeability) and Pump2 (high permeability during yielding). The pressure gradient across the shear zone in Pump1 is higher than that in Pump2 (colour scales are the same for the two rows), because the high permeability of the latter allowed pressure more efficient pressure equillibration. Fluid velocity is proportional to permeability times pore pressure gradient (K*Grad PP. The ratio of the measured maximum velocity within the shear zone at step 60600 for Pump2/Pump1 equals ~4 and is similar to the ratio of the K*Grad PP values for Pump2/Pump1 (K1=1, Grad PP2=1.778e-5, and K2=5, Grad PP2=7.23e-5).
| Pump1. K=ct. | Pump2. K increases upon yielding. |
 |
 |
 |
 |
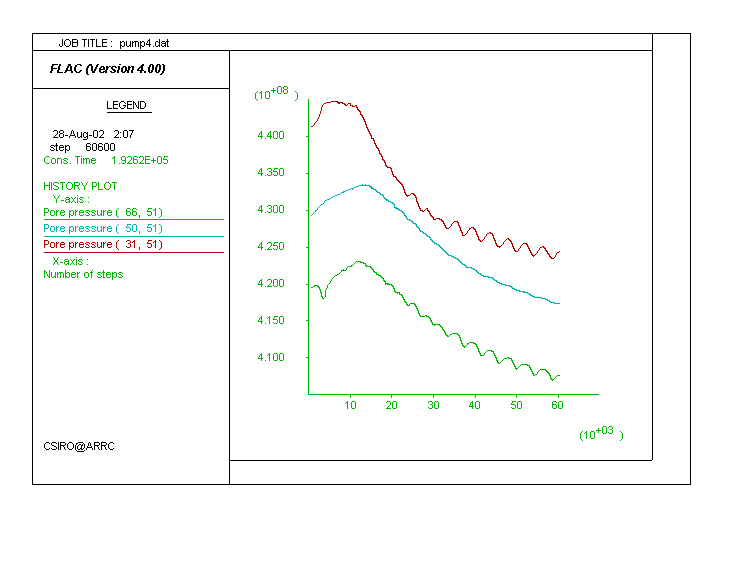
Model Pump4. Includes both the VSI and State functions. Results in essentially similar pore pressure history to those models above. The movie shows the flow at the upper tip of the shear zone. It depicts variations in velocity of the fluid (arrows and the value on the left-hand-side for Max. Vector) and its relation to the state of the country rock (yellow means tensile cracking, red means shear fractures).
|
| Movie: Fluid Flow Material properties FLAC input file |
A new model was run using half the boundary velocity of above and with increased relative velocity between fluid flow and deformation (as measured by the number of fluid flow calculation steps to deformation steps 10:1 ratio instead of 1:1 ratio, effectively decreasing the deformation velocity by one order of magnitude). A further difference was an increased discharge at the base of the model. The VSI function was turned off and the permeability changes upon state changes were made extreme, increasing by 1.e6 compared to the original permeability when yielding and decreasing by 1.e-2 compared to the original permeability when yielding stops, effectively modelling fault cracking and sealing. Unlike the results above, this model results in yielding only along the fault zone, and nowhere else, and the history of unbalanced forces is good and accompanied by a very steady evolution of the pore pressure history across the shear zone. Unlike the models above the permeable sandstone above the fault does not yield considerably and erratically.
A) Volumetric Strain Increment (VSI) distribution around the fault zone. B) Evolution of state and fluid flow in the area immediately surrounding the shear zone.
A) VSI  |
B) Movie: state and flow
|
Material properties
FLAC input file
A) Unbalanced forces and B) pore pressure histories.
This diagram plots the pore pressure history of three points in the model: one point above the shear zone (green line, low pore pressure), one within (blue line) and one below (red line, high pore pressure) the shear zone.
 |
 |
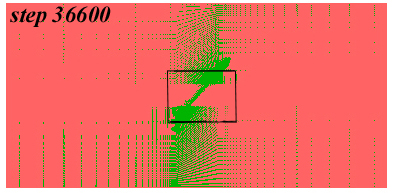
Pore pressure evolution around the shear zone at different steps. In A) the shear zone has not yielded so that pore pressure increases rapidly below the imperemeable barrier. In B) through D) the pore pressure keeps increasing due to fluid influx to the base but the shear zone provides a pathway for the fluids causing a partial release of pore pressure below the impermeable layer and an increase in pore pressure above the shear zone as evidenced by the opposite curvatures of the pore pressure contour aove and below the shear zone most clear in (D). Click here for movie of the pore pressure evolution around the shear zone. Note the opening of the shear zone as a fluid pathway revealed by the pore pressure increase within it and note also the increase in pore pressure above the shear zone.
A) Step 6600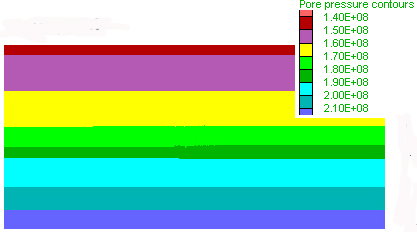 |
B) Step 28600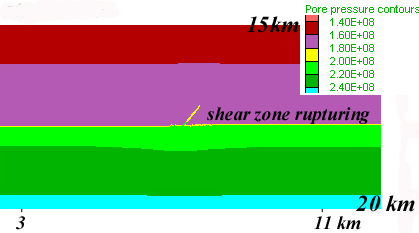 |
C) Step 36600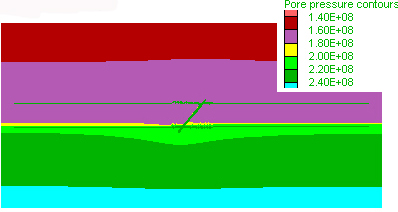 |
D) Late detail: step
44000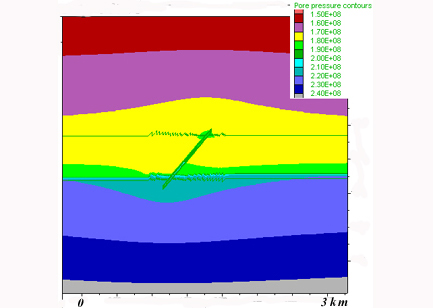 |
DISCUSSION AND CONCLUSIONS
While the models respond to the addition of the State and VSI functions as indicated by the permeability histories and the effect on fluid flow velocity within the shear zone, it is unclear whether the wave pattern of the pore pressure history is a result of the non-linear dynamics of the system or a result of numerical instability. We investigated the influence of the pore pressure variation in the velocity (not shown above) and found that the velocity varies in tandem with and by a proportion similar to that of the pore pressure. It is concluded that while this study reveals the non-linear relationship between permeability, pore pressure gradient and fluid velocity, the results did not reveal any significant fluid pumping. It might perhaps be necessary to cause the permeability to vary much more widely during shearing (orders of magnitude), perhaps also including an effective sealing mechanism that would significantly decrease shear zone permeability. Another possibility is to explore the strength of the shear zone. It was probably too weak in the models above.