Main Page
About Me
Research
Links
Contacts
| Introduction | Regime Properties | IR-Only Regimes | Statistical Model | GCM Evaluation | Precipitation Changes | References |
|---|
Cloud Regime Properties
 |
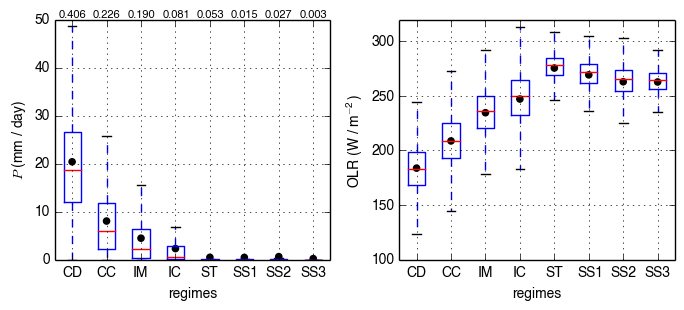
| Figure 1: Box-whisker diagrams of the composites of rainfall (left) and outgoing longwave radiation (right) with regimes. |
This section provides a brief outline of my article On the Identification of the Large-Scale Properties of Tropical Convection using Cloud Regimes in Journal of Climate.
Cloud regimes are classifications of the populations of different clouds within grids of 280 km horizontal resolution and indicates the character of convection on that spatial scale. This allows us to composite the regimes with different large-scale variables with two different purposes. One, compositing with conventional measures of convection such as outgoing longwave radiation and precipitation confirms and elucidates the convective properties of each regime. Two, compositing with variables quantifying the atmospheric environment advances the statistics of various convective environments.
Figure 1 shows the box-whisker diagrams of the composites of the regimes with precipitation (from the Global Precipitation Climatology Project 1DD dataset) and with outgoing longwave radiation (from the ISCCP FD dataset). We can see a clear progression of regimes, CD to CC to IM to IC to the suppressed regimes (S*), from the most convective regime to convectively-suppressed regimes. This confirms our assumption on the convective nature of the regimes which was previously based solely on their cloud morphology. Furthermore, the precipitation profiles showed that the most convective regime, CD, is heavily influenced by high precipitation, with the precipitation-regime relationship being nonlinear.
 |
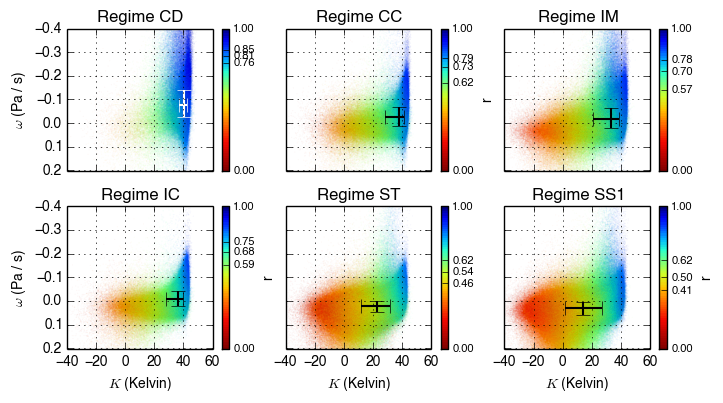
| Figure 2: Multivariate scatter diagrams showing the relationship of the large-scale variables with each regime. |
Having verified the capacity of the regimes to act as proxies for convection, we then composite it with different large-scale variables. Specifically, we choose three variables describing the humidity, stability and dynamics of the atmosphere: saturation fraction (r), modified K-index (K) and vertical velocity (ω). Exact definitions can be found in Tan et al. (2013) and references therein.
Figure 2 shows the composites of these three large-scale variables with the regimes in a scatter diagram (SS regimes are combined due to their apparent similarity). K is displayed along the horizontal axis, ω is displayed along the vertical axis, and r is displayed using colour. The quartile values are also marked using error bars and values on the colour bar. It shows that each regime inhabits in a different large-scale environment. Regime CD, which represents highly-organised and intense convection, is dominated by wet environments (blue), have a substantial amount of points in large-scale ascending motion (negative ω), and is generally unstable (high K). Progressing towards less convective regimes intrudes into the dry, descending and stable environments, with the suppressed regimes sharing similar large-scale environments.
While a deterministic component between the large-scale variables and convection is apparent in Figure 2, we can also see considerable overlap in the composites. Such an observation is consistent with recent literature that the relationship between convection and the large-scale has a stochastic component at this scale. This casts doubt into the adequacy of most convective parametrisation schemes in global-scale climate models, as the connection between the convection within a grid box and the large-scale environment that drives it is deterministic.