Elliptical Structures in W Broken Hill Block: Large Scale Fold Interference Pattern |
| Successful mineral
exploration needs to be able to predict accurately the continuation at
depth of a known mineralization or of a prospective horizon. For such a
job good 3D geological models are required and structural tools have
been
used for 3D prediction. However, our ability to accurately predict the
geometry of complex, poly-folded terranes such as Broken Hill has been
relatively limited. This is because prediction requires a detailed
lithological map integrated with a detailed structural understanding of
the area, and this has historically been missing at Broken Hill.
This web-page derives the 3D geometry of a poly-folded area in the Broken Hill Block through integrating detailed mesoscale geological documentation of a small area, with the 2D map pattern of rock distribution using Noddy and building on previously published ideas (Hobbs et al., 1984). The results explain the complex map patterns while also revealing a likely distribution of lithologies at depth. The method developed here is simple and robust and can be used in other poly-folded terrane. The 3D models can be tested and detailed through inverse modelling of geophysical data such as Airborne Gravity Gradiometry, or TMI. CLICK ON ANY PHOTO FOR HIGH RESOLUTION VERSION |
Geological Map of the Elliptical Structures, NW Broken Hill Block
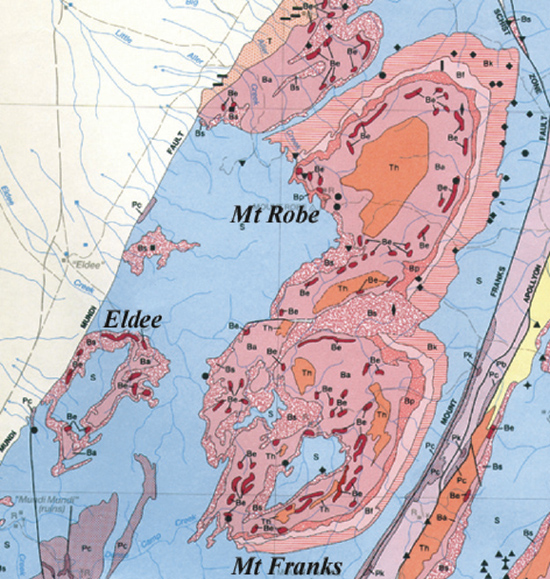 CLICK ON FIGURE FOR FULL MAP |
The geological map of
the W Broken Hill Block (W of the Apollyon Fault) shows three
elliptical structures between 3.5 and 8 km in length defined by the
distribution of lithologies. The Eldee structure,
close to the Mundi Mundi Fault (Hills et al., 2001, Hobbs et al., 1984)
is a ~3.5 x 2 km elliptical ring defined by a ~500 m wide layer
containing abundant amphibolite and pegmatite within a partially molten
schist, interpreted by the Geological Survey of New South Wales to
represent part of the Broken Hill Group. This ring is surrounded by
younger Sundown Group rocks, but also enclosed Sundown rocks in its
interior. The ring of
Broken Hill Group rocks is clearly defined by the red tones in the
gamma-ray spectroscopy image shown below, while the Sundown Group rocks
inside and outside the ring is well-characterized by the whiteish tones
in the same image.
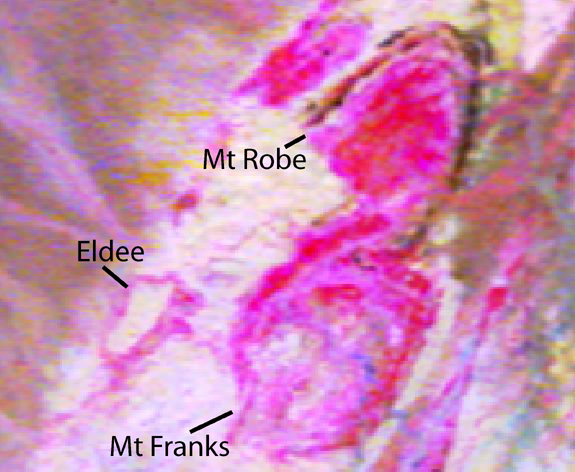 From BHEI2000 Curnamona Province GIS, AGSO The Mt Franks and Mt Robe
elliptical structures are larger and different than the Eldee
structure.
The Mt Robe structure has the Broken Hill Group ring surrounding a core
of older Thackaringa Group rocks, rather than the younger Sundown
rocks.
The Mt Franks structure, by contrast, has Thackaringa Group rocks as
part of the ring which surrounds a core of younger Sundown rocks.
These three elliptical structures, similar in general but different in
their detail, suggest that they resulted from a similar but complex
pattern of folding. Hobbs et al. (1984) interpreted these structures as
resulting from kilometre-scale interference between upright,
N- to NNW-trending folds and NE-trending folds, superimposed on the
lower limb of an earlier macroscopic recumbent
fold, forming a doubly plunging synformal anticline. In this web-page we first provide a brief and as yet incomplete description of structures mapped around the Eldee Creek. This is followed by a section where the 3D Noddy model is built based on our structural understanding. A problem with the relative position between Mt Robe and Mt Franks structures is explored, by inverting the vergence of F2 folds from north to south. This is followed by a study of the possibility that the structures are derived from an early sheat folding event, overprinted by smaller, later folds with no major effect on the broad shape of the structure, and then by "Discussion and Conclusions". |
Mesoscopic Structural Geology
| In this section we briefly demonstrate the
interference between fold phases as recorded by rocks around the Eldee
Creek in the northern end of the Eldee Structure.
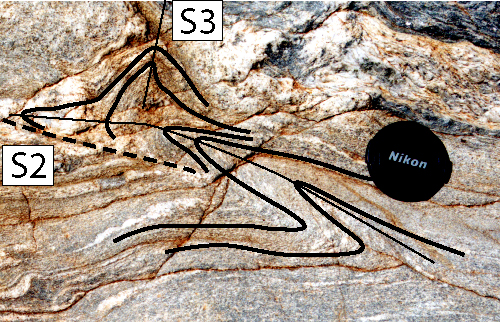
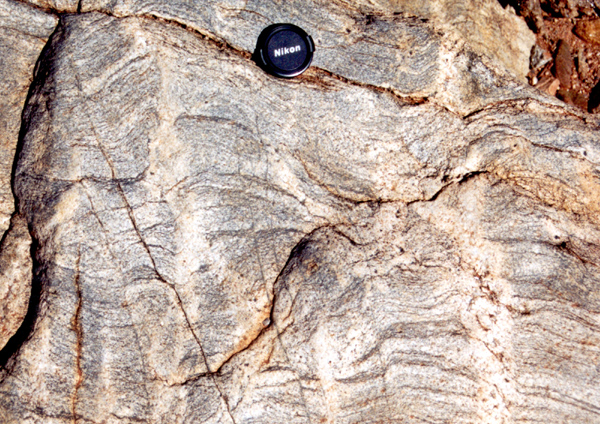
An early deformation phase folds a pre-existing S1//S0 foliation giving rise to inclined to recumbent F2 folds and S2 axial planar foliation (Figs 1, 2 and 3). F2 folds commonly ride a melt-filled detachment thrust plane (Figs 1, 2 and 3). F2 folds are generally asymmetric and generally verge towards the NE quadrant (anywhere from ~NNW to ~ESE). The variation in their vergence and axial plane orientation is related to refolding by later folds (Fig. 5), and the pattern was interpreted to indicate original vergence roughly to the north, as originally interpreted by Hobbs et al. (1984). F2 folds are overprinted by an upright, NE-trending S3 foliation and associated folds, that vary from open to tight (Figs 2 and 3). These folds are in turn overprinted by E-W trending S4 foliation and broad folds. Pegmatites can be found parallel to S0//S1 and folded around F2. They can also be found parallel to the axial planar foliation of F2 folds and associated thrusts (Figs 2 and 3), as well as parallel S3 axial planar foliation (Fig. 4). |
 |
 |
 |
|
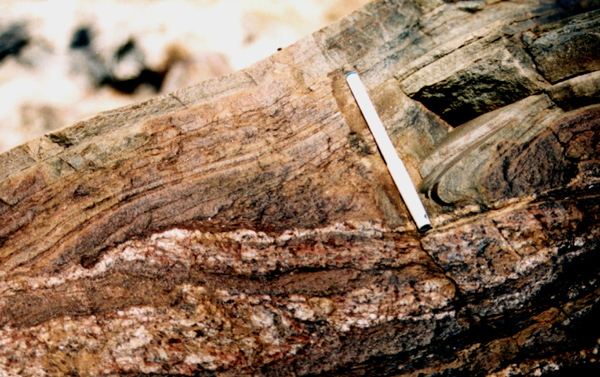
Figure 1. F2 fold riding a melt-filled detachment thrust. |
Figure 2a. Tight, inclined, asymmetric, N-verging F2 fold developing into a thrust, and refolded by a NE-trending upright F3 fold, top left-hand corner. | Figure 2b. Interpretation of Fig. 2a. |
 |
 |
 |
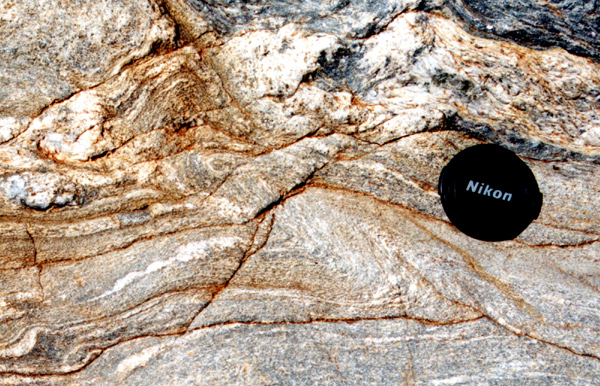
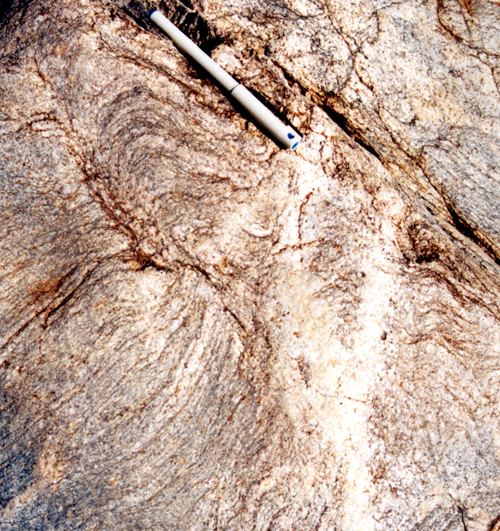
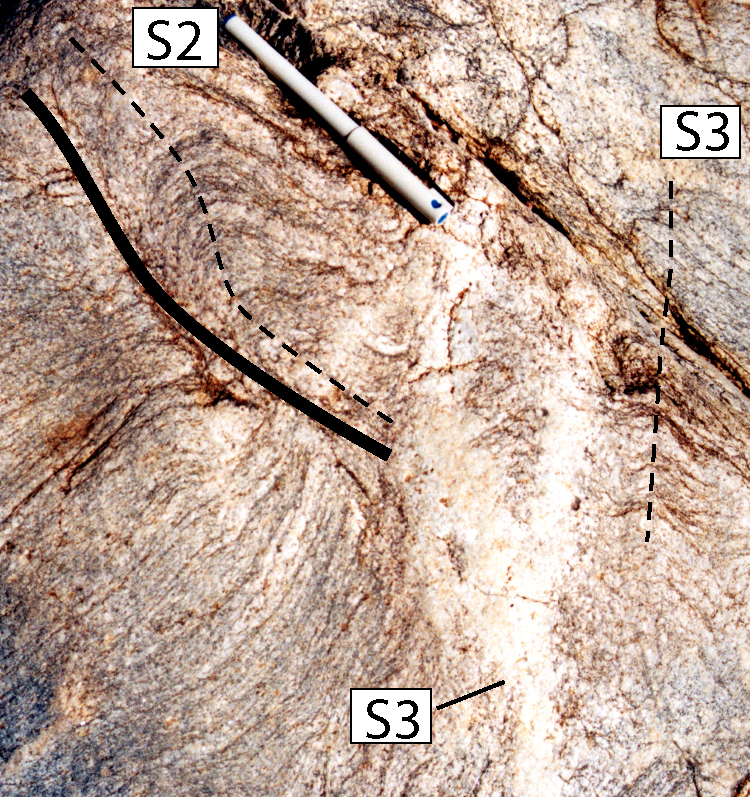
| Figure 3a. Similar to Fig. 2. F2 asymmetric fold and thrust, verging N, cut by a later NE-trending aplitic vein, parallel to S3. | Figure 3b. Line drawing of Fig. 3a. | Figure 4. Pegmatitic veins parallel to S3, cross cutting S1//S0. which also define broad F3 folds. |
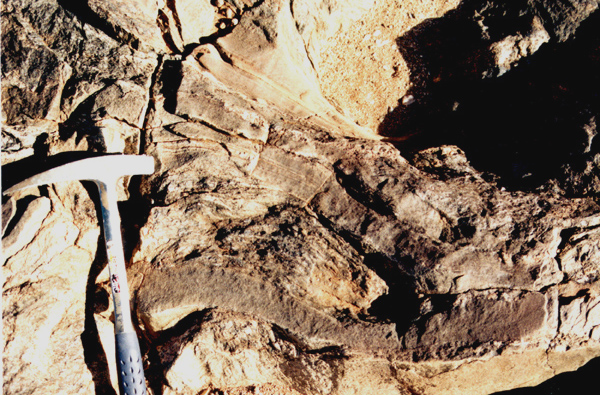 Figure 5a. F2 folded refolded by F3. |
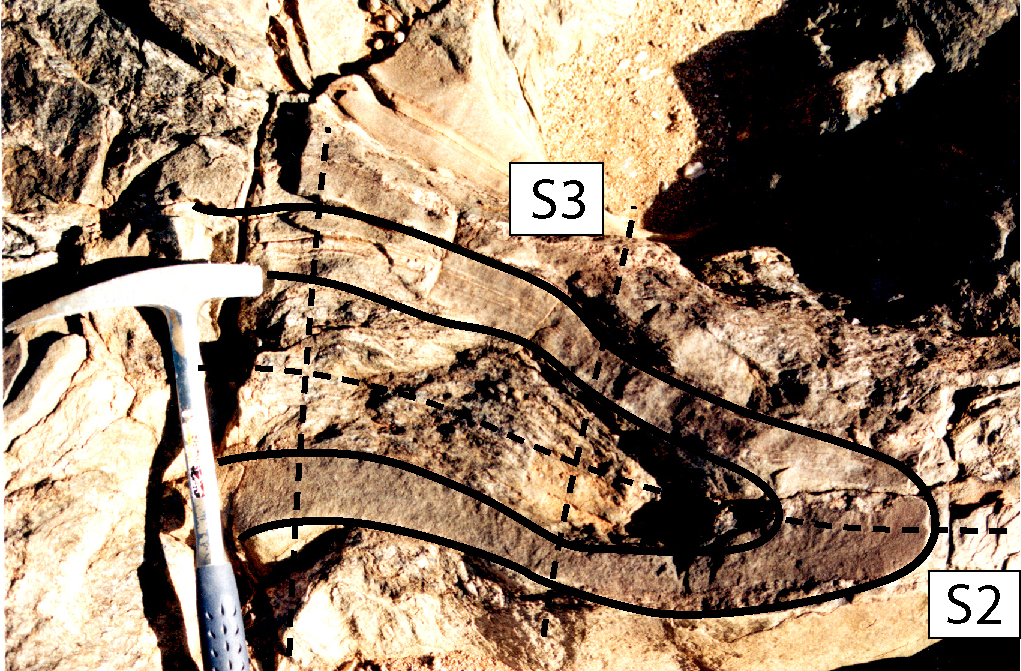 Figure 5b. Line drawing of Fig. 5a |
Fig. 6. Summarizing
figure of the structures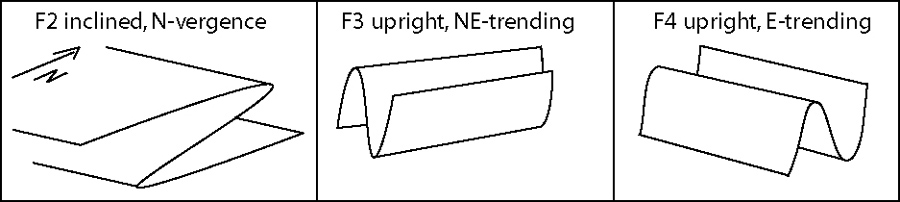 |
| A 3D model was built using Noddy
through a few iterations, where the the wavelength of all folds was
kept constant at 4km, and the amplitudes were varied in order to find
best match with the large scale elliptical structures mapped by the
Survey. Two models are presented. They are essentially similar except
for different thicknesses of the sedimentary package. The absolute
value of the sedimentary package is unimportant, the important value is
the ratio between fold amplitude/wavelength and package thickness. The
three rock Groups that crop out in the elliptical structures are
used in the models.
According to Stevens et al. (1983, Records of the Geological Survey of
New South Wales) the stratigraphic layers
generally have the following thicknesses:
|
| MODEL SPECIFICATIONS
Fold Phase |
Hobbs et al.'s Model
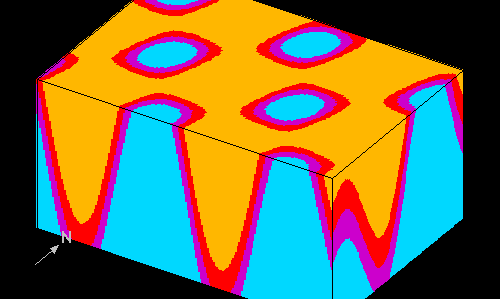 Fig. 7. We start this investigation by testing the 3D model proposed by Hobbs et al. (1984). The model uses an inverted stratigraphy and a NNW-trending upright fold (wavelength 4km, amplitude 2km) overprinted by a NNE-trending upright fold of similar dimensions. The model takes a simple inverted stratigraphy to produce the dome-and-basin interference pattern. The model does not produce the full complexity of the patterns observed in the structures. We will investigate below models that use our structural work, but that are ultimately similar to that of Hobbs et al. but with one small but essential difference: to produce the complexity of the structures, rather than folding an inverted limb of an early fold, both limbs of this early fold need to be folded together. |
New Models
Model 1. Thick,
7km-package
 |
Model
2. Thin, 3km-package 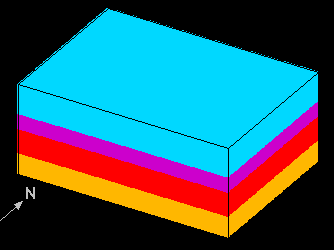 |
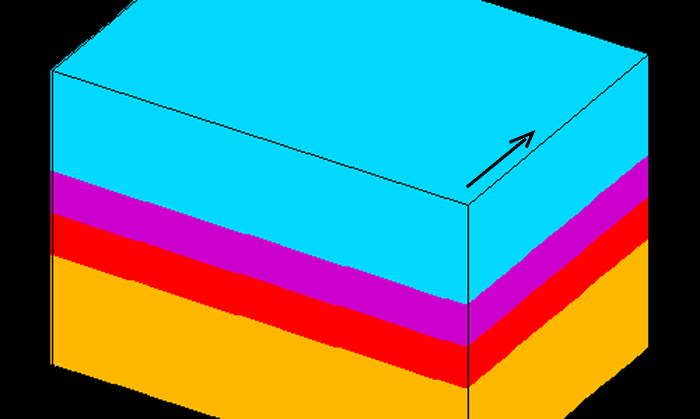
| Fig. 8a. Model 1, flat stratigraphic sequence, arrow points to N. S0//S1. The width and length of the top surface are both 10km, and the box is 7km deep. | Fig. 8b. Model 2, flat stratigraphic sequence. The differences to Model 1 are the dimensions of the box and the amplitude of the folds. The width and length of the top surface are 7 and 5km respectively, and the box is 3km deep. The dimensions of F2 is the same as in Model 1, but F3-F4 have an amplitude of 2km. |
Model 1. F2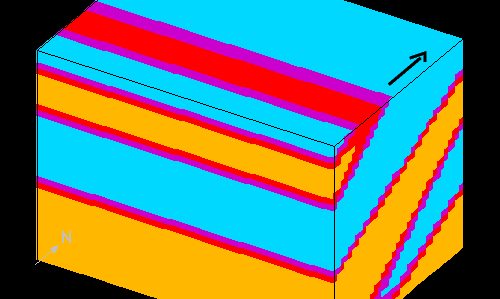 |
Model
2. F2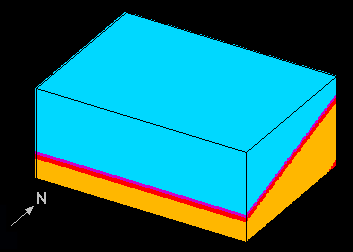 |
Fig. 9a. F2: inclined 20o, N-verging folds, amplitude=8km. |
Fig. 9b. Identical fold parameters to those of Fig 9a. |
Model 1. F3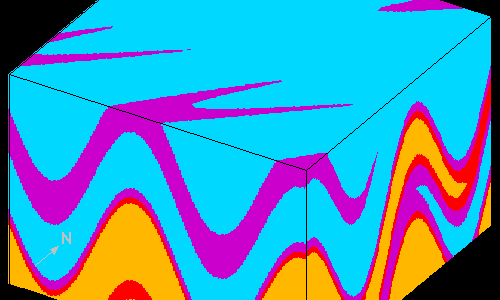 |
Model
2. F3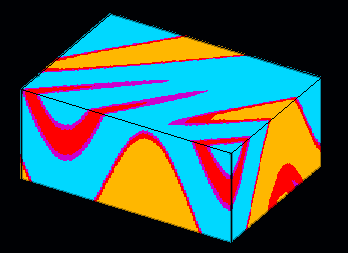 |
| Fig. 10a. F3: NE-trending, upright folds, amplitude=2km click here to see amplitude=4km. The superposition of these two phases give rise to an interference pattern intermediate between Ramsay and Hubber's Type 2 (mushroom pattern) and Type 3 (convergent-divergent pattern). | Fig. 10b. Identical fold parameters to Fig. 10a. The difference that controls the patterns is the thickness of the sedimentary package. |
Model 1. F4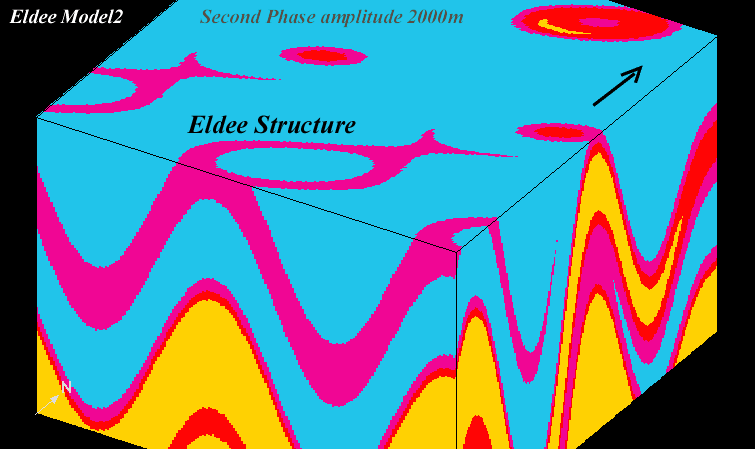 |
Model
2. F4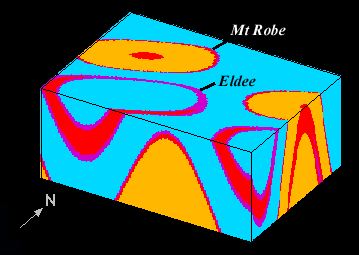 |
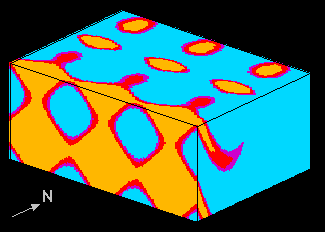
| Fig. 11a. F4: E-trending, upright folds, amplitude=1.5km. Change in the amplitude of F4 up to 4km does not change the shape of the circular structures in their essence. The superposition of the three fold phases documented at mesoscale, give rise to the oval structures observed in the NW part of the Broken Hill Block. In this case, the structure is similar to Eldee, with the youngest Sundown Group rocks both inside and outside the structure separated by a ring of the older Broken Hill Group. | Fig. 11b. Like Fig. 11a but amplitude=2km. Note that this case gives rise to a structure similar to Eldee, and to a structure similar to both Mount Robe and Mount Franks with the older Thackaringa Group rocks forming part of the ring but younger rocks cropping out towards the core. In this case, deeper erosion would expose Sundown Group rocks in the core of the ellipses like documented at Mt Franks. |
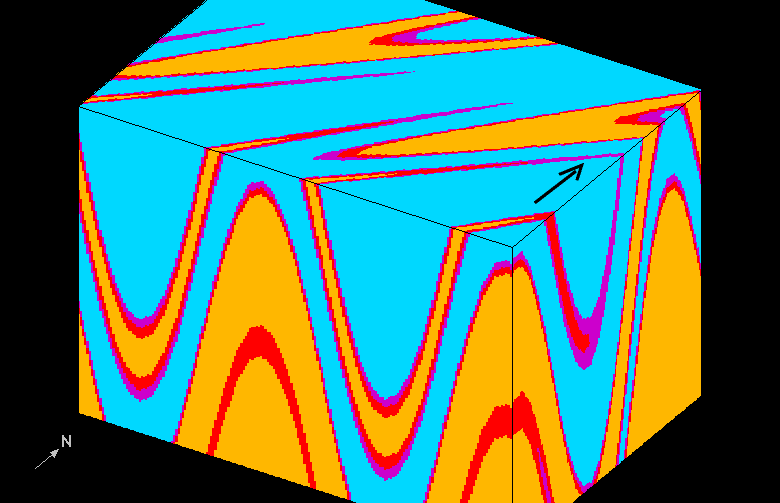
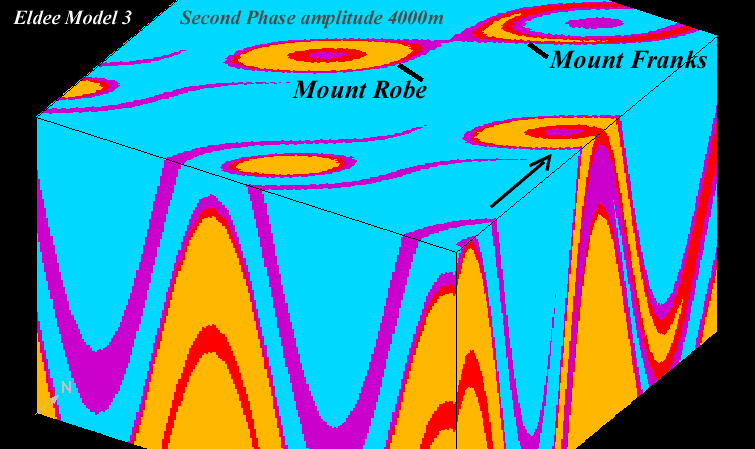 Fig. 12. Same as Fig. 11a, but F4 was superimposed on F3 folds of 4km (instead of 2km) Increasing the amplitude of F2 folds, changes the rock distribution at the surface of the model so that the oval structure has a broadly similar rock distribution to the Mt Robe and Mt Franks structures. |
| In the models above the Mt Robe and Mt Franks structures are relatively well reproduced by the models. However, their relative geographical positions are inverted. The structure most similar to Mt Robe in the models is south of the structure most similar to Mt Franks. The opposite is true in the nature. This is easily fixed by inverting F2 vergence from north to south, as shown in the model below. In this model, the wavelength of F3 folds was changed from 4 to 6km leading to wider ellipsis, and leading also to the two structures being slightly stepped along their length (en-echelon). Furthermore, the amplitude of F4 was modified from 1.5km to 1.3km, in order to slightly enhance the opened shape of the southern Mt Franks structure. In this case the ring is open so that the Sundown Group rocks (in blue) in the core merge with that outside through a gap in the ring on the south side of the structure, similar to the the natural analogue. |
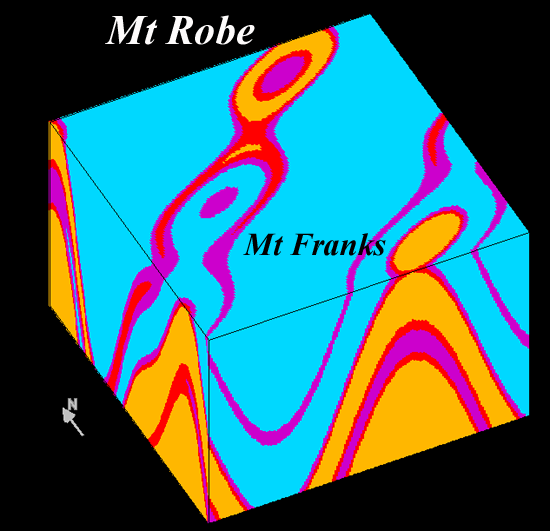 Fig. 13. Interference pattern where F2 verges south, producing Mt Robe and Mt Franks structures in their correct geographic postion, including the slight en-ecehlon relationship and the southward merging of core Sunwdown with external Sundown rocks. |
| The model put forward by Hills et al. (2000) based on detailed structural work is that the Eldee structure is a result of an early phase (F2) of sheath folds, later overprinted by small scale F3 and F4 folds. Here we test whether an early phase of sheath folds overprinted by F3 and F4 could produce the elliptical structures. Obviously a single phase of sheath folding cannot produce a structure like Eldee with Sundown Group rocks both inside and outside, and we demonstrate further that superimposing another fold phase to a large scale sheath fold does not produce the structures either. We argue that to produce the elliptical structures requires first that the original package be folded in an inclined or recumbent manner, and that this be followed either by a single steep sheath fold phase (not tried here) or by two separate fold phases that produce a dome and basin structure, which is the model we developed above. |
 |
 |
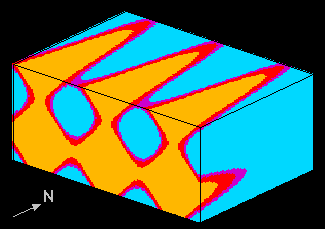
| Fig. 14a. Plain recumbent sheath folds formed by a single non-cylindrical fold phase. This model uses the thin sedimentary package, and a wavelength and amplitude of 2.5km. | Fig. 14b. Sheath fold in (a) overprinted by an E-W trending upright horizonatl fold phase with a wavelength of 6km and an amplitude of 2km. Many variations on the theme were tried including steep sheath folds, and many models, like the one shown above, produces elliptical map patterns but do not reproduce the rock distribution patterns mapped out in Eldee, Mt Robes, Mt Frank. |
| The Noddy models assume that all three
deformation phases developed folds
that were expressed regionally at a similar wavelength and amplitudes
of the order of kilometers, with an amplitude to wavelength ratios
between 0.3 and 2, and wavelegth to layer thickness ration
of the order of 2.5.
1. Predicting 3D geometry from surface maps is nigh on impossible in the absence of detailed structural knowledge. The distribution of lithologies in 3D cannot be predicted from their surface distribution alone. 2. Three phases of cylindrical folds are required to produce the oval structures which characterize the NW part of the Broken Hill Block. The structures produced by Noddy replicate the map patterns at Eldee, Mount Robe and Mount Franks structures. 3. This work delineates the basic steps necessary to understand the complex 3D geometry of poly-folded rock packages: a) detailed lithological mapping, b) detailed structural analysis, c) integration of the two studies with the help of 3D visualization tools such as Noddy. 4. The next step in further constraining the 3D geometry of such a terrane is to use the 3D models generate to forward model the geophysical signature of the model and compare to available geophysical surveys. In the case of the Broken Hill Block, gravity studies are the most promising for this purpose, but improved knowledge of densities of rock packages are required. 5. Hills et al. (2001) determined that the N and S closures of the Eldee structure plunges moderately SW and these are linked by limbs dipping to the W defining a slightly flattened W-plunging cylinder. This contrasts to the vertical plunge in our model. This can easily be modified by either tilting the geology to the NE after all folding events or by tilting the axial plane of each folding event. 6. The elliptical structures in surface are approximately 4km long and 1.5km wide. The length and aspect ratio of the structures can be changed by modifying the wavelength of the fold phases. For example by increasing the wavelength of F4 folds from 4 to 6km, the length of the structures increase to 6.5km while the width remains constant. In contrast, if F3 wavelength is increased from 4 to 6km (keeping F4 at 4km), the width of the structures increase to 2.3 km while the lenght remains close to 4km (Fig. 13). 7. Using north-vergence for F2 folds results in the Mt Robe structure being south of the Mt Franks structures, opposite to what has been mapped. This is solved by inverting the vergence of F2 folds, in contradiction to our inference based on field work in the Eldee Creek area. This could be a result of our information on vergence being derived from a single limb of a large scale fold. More work needs to be done to establish this. 8. This work uses tools that did not exist at the time the seminal work of Hobbs et al. (1984) was produced. Using Noddy we were able to fine tune the conceptual understanding that they developed two decades ago.
|
References
| BHEI 2000 Curnamona Province GIS, AGSO.
Hills, Q.C., Giles, D., Rosenbaum, G., Forbes, C., Lister, G.S., 2001. The Eldee structure: a kilometre-scale sheath fold at the northwestern margin of the Broken Hill Block, NSW, Australia; SGTSG Abstracts, Ulverstone, Tasmania, 64, p. 81-82. Hobbs, B.E., Archibald, N.J., Etheridge, M.A., Wall, V.J., 1984. Tectonic history of the Broken Hill Block, Australia; in Kroner and Greiling, (eds) Precambrian Tectonics Illustrated, p. 353-368. |