Introduction
- The "Asymptotic Giant Branch" is so-named because for some stars the evolutionary track up the giant branch, for the second time, approaches the first giant branch almost asymptotically. It used to be called the "second giant branch" which is perhaps a better name, rather than relying on a morphology which is not always present or obvious. In any event, the AGB evolution is divided into two phases: the early-AGB (E-AGB) and the thermally pulsing AGB (TP-AGB). The onset of thermal pulses is the dividing line between these phases.
- The graphs and models shown in this section are from the evolution of a 5Msun model with Z=0.02.
E-AGB
- The second dredge-up phase is actually a part of the E-AGB, but was discussed earlier. We shall only briefly discuss the E-AGB again, as we shall concentrate on the thermally pulsing phase. Note that the second dredge-up does not occur for all masses, but only for masses above about 4 Msun, although this number depends on the composition slightly.
- Following core He exhaustion, the He shell is established and
as it moves through the He profile the high luminosity generated
causes the star to expand, and the H shell is extinguished (or
nearly so). Thus the continued expansion causes the outer layers
to cool, and the opacity rises, causing convection to dominate
as the energy transport mechanism. Hence the second dredge-up
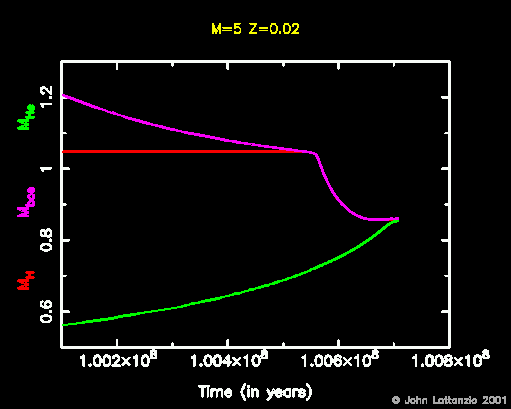
phase is initiated. The graph below shows the inner edge of the
convective envelope moving inward, through the position of the
H-shell (defining the H-exhausted core). All the time the He
shell is moving outward, also. The shells get very close together,
as shown in the diagram.
- The next movie (
horizontal and vertical )
shows the H and He profiles versus time during the times shown in the above
diagram. A grey line moves across the diagram above to indicate the time for
which the abundance profiles are being displayed. Note the He shell advancing
outward due to burning, and the H shell being pushed inward by the dredge-up.
The final result is that the H ad He shells are very very close
together!/li>
- The CO core: core He burning initially produces C-12 from the triple-alpha reactions, and then once there is some C-12 present the C12-(alpha,gamma)O-16 reaction produces some O-16, as we saw in the earlier evolutionary phases. But shell He burning is another matter. By the time there is some C-12 built up there is very little He left to form O-16. A convective core keeps mixing in fresh He but a radiative shell does not. Hence the main product of shell burning is C-12 rather than O-16. The C ad O abundances during the E-AGB phase are shown in the next movie.
- The next movie shows
the luminosity profiles during the E-AGB phase, including second dredge-up.
You can clearly see the rise in the luminosity. Also, the line is colour
coded according to the H and He abundance. The cyan part shows the region
of variable H abundance, which is usually the H burning shell. But when
the second dredge-up begins there is no region of variable H abundance!
The H content drops from the surface value to zero at a discontinuity.
Hence the cyan points disappear during second dredge-up. I had not expected
my algorithm for selecting the H shell to do this, but its nice that it does.
However, then we have two very slightly different shades of blue next to
each other, so these movies will have to be re-made now that this feature
is so clear! Nevertheless, it is very instructive: you can see (if you look
carefully!) the join between these two shades of blue move inward with
time: this is the second dredge-up! All the while, of course, the He shell
is strengthening and the luminosity is increasing. The He shell is shown
in magenta and it is clear that this is providing all of the luminosity
during this phase. At the end of the second dredge-up the H shell is
re-ignited and the last frame shows the cyan H shell in place again,
and also shows that it provides most of the star's luminosity now that
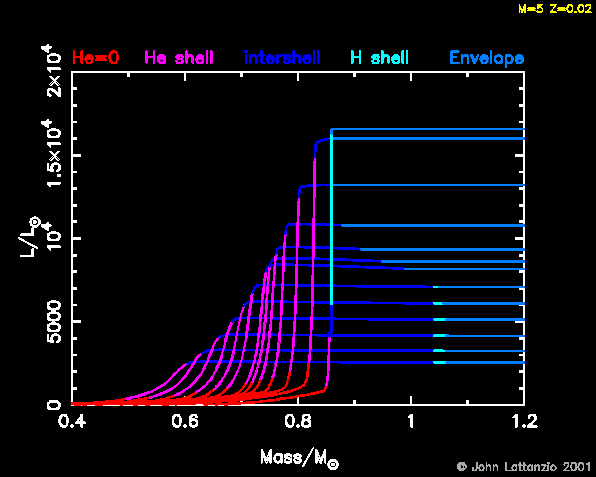
the He shell has reached its new position. The picture below shows all
the L profiles superposed on each other.
- Next we show the temperature. There is a lot of information here, too. Firstly, notice how the relatively flat profile initially turns into the classic core-envelope structure, with a very flat (isothermal) core and a very steep drop at the edge of the core. Again, you can see the cyan region (the H shell) disappear during dredge-up. Just prior to this you can see it cool, then it moves inward in mass as a result of the dredge-up. Finally, the shell is re-established and the star has a double shell-source structure: a He-shell (shown in magenta) and a H-shell (shown in cyan).
- The radius shows the expansion also. Watch the H-shell being propelled outward by the energy liberated by the He shell. Then the second dredge-up moves it inward in mass (but at almost constant radius!) while the He-shell moves outward and gets thinner. Eventually we have a very compact CO core (at a radius of about 0.01Rsun, and then the He and H shell at almost the same mass, and also very close together in radius.
- The density shows a predictable behaviour, again displaying the core-envelope structure and the close proximity of the H ad He shells.
The Thermally Pulsing-AGB
- We now move toward the first thermal pulse. The two shells
are geometrically thin and very close together, and this, combined with
the high temperature dependence of the helium burning reactions, is
thermally unstable. The output of the shell begins to oscillate as show
below. Then a genuine thermal pulse develops, with the helium luminosity
reaching up to a few times 10^5Lsun.
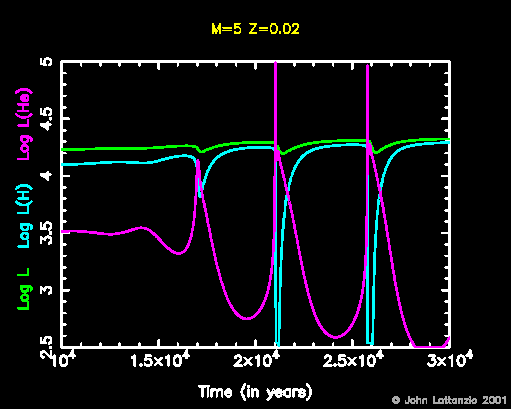
- Of course, this energy causes the star to expand, and the H shell is propelled outward to lower temperatures and densities so it is almost extinguished. Note that the total surface luminosity hardly changes, however!
- It is instructive to look at the time variation of some critical mass
positions in the star. The figure below shows the inner edge of the convective
envelope as well a the position of the H-shell (defining the H-exhausted
core) as well as the He-shell (defining the He-exhausted core).
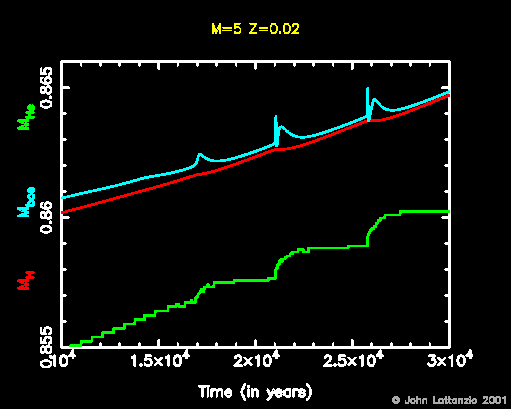
- The cyan line shows the inner edge of the convective envelope. This will show dredge-up in later pulses, but not for these earlier ones. The red line is the center of the H-shell, which is equivalent to the edge of the H-exhausted core. Finally the green line shows the edge of the CO-core, or the position of the He-shell. Note that the He-shell moves outward primarily during a pulse, rather than between pulses. On the contrary, the H-shell moves out3ward during the interpulse phase mostly, and is essentially stationary during the (brief time of the) pulse.
- Here ( horizontal and vertical ) are the H and He profiles during the early pulses. Note the alternate movement mentioned above: the H-shell moves outward mostly between pulses, when the star is powered by H-burning. But at the pulse, the He-shell is active and the He-shell position moves outward (this is all in mass, of course!).
- Next is the ( horizontal and vertical ) He, C-12 and O-16 profiles during the early pulses. Note that the outer edge of the red line (the H-shell) moves outward during the time between pulses. Then, at the pulse, the inner edge of the red line (where the He is destroyed, thus indicating the position of the He-shell) catches up. In fact, the inner edge of the red line corresponds also to the production of C-12, whose profile is shown in green, and the small amount of O-16 is show in blue. These all move pretty much as one, during the pulses, which is to say, during the time of active He burning. )
- Here are the luminosity profiles ( horizontal and vertical ) during the early pulses. The profile is colour-coded to show whether it is the H or He shell that is producing the energy. Initially, the H shell is clearly visible (cyan part and produces most of the energy. You can see the oscillations of the He-shell (magenta) as the first major pulse approaches. Note that the H-shell is extinguished during the pulse: the energy generated by the He-shell is very large, and goes into expanding the star. You can see the region of absorption: it is where the luminosity decreases with mass, moving outward. Note that despite the contortions of the L profile, the surface luminosity (green line i second frame, or very nearly the right-most value in the L-profile frame) is almost unchanged. )
- Using the same colour-coding, we show here the T profiles ( horizontal and vertical ) during the early pulses. The second frame shows the time-variation of the temperature at a representative position in the H and He-shells. Note that their behaviour is opposite of each other! During a pulse, the He-shell gets hotter but the H-shell cools (due to the expansion powered by the energy from the He-shell). )
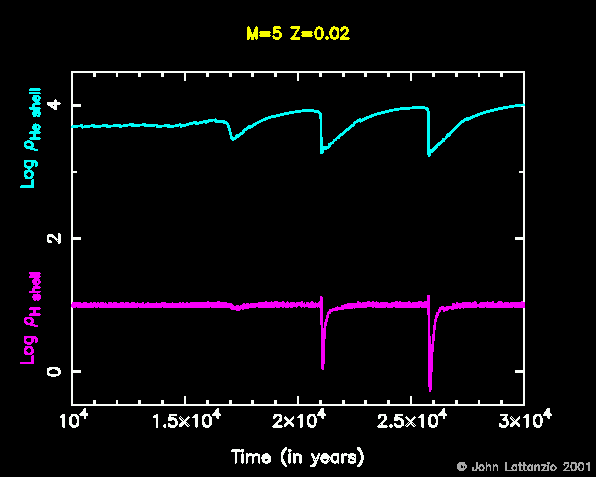
- Closely related to the previous figure is the behaviour of the
density in the shells. In this case we see the expansion of the star is
evidenced in the decrease in density.
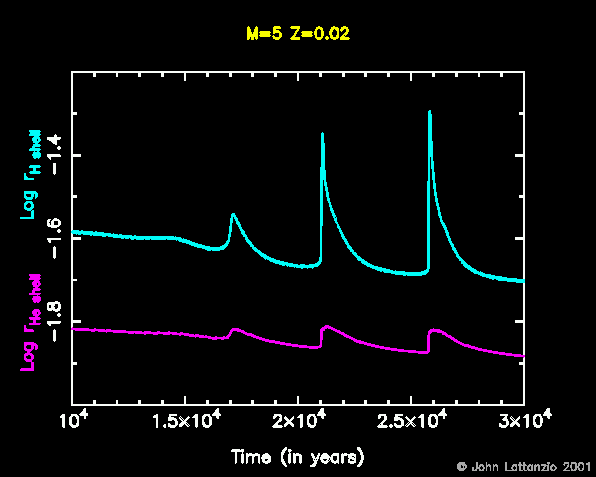
- The last in this series shows the position of the two shells, in
radius. For these pictures we have picked a point near the bottom of the
H-shell (where the H abundance is about 0.05 typically) so that we can
display both shells on the same axes. The He shell position is closer to
the centre (i.e. to a He mass-fraction of about 0.5). Again, here we see
the dramatic expansion of the H-shell, being propelled outward in radius
by a factor of 2!
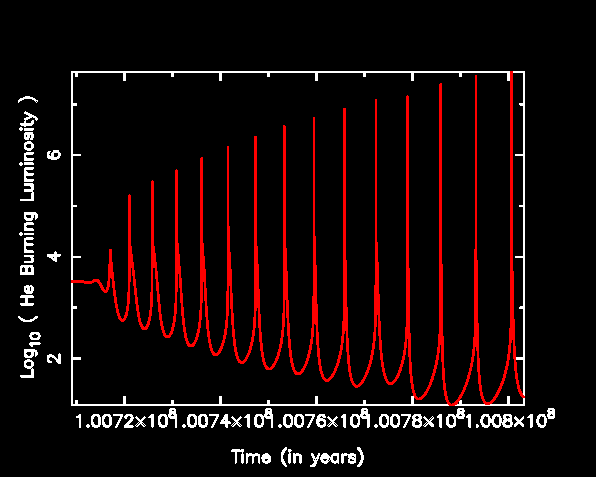
- The instability that we have seen develop in the above, continues
to recur and grows in strength during the AGB evolution. Here are the first
few pulses for the 5Msun model with Z=0.02. Note that the Helium luminosity
grows to
10^8 Lsun very quickly.
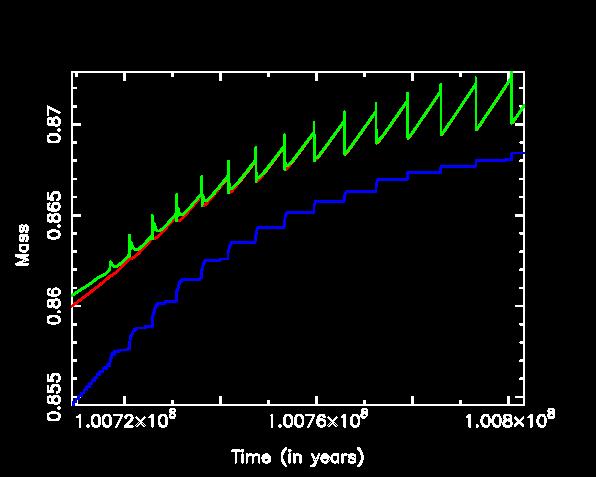
- The figure below shows the position of the H and He-shell, as well as the convective4 envelope, during the same time as the above diagram shows the growth of the He instability. With each pulse, the expansion gets stronger and eventually the convection reaches in beyond the (now extinct) H-shell. This is the "third dredge-up" and is clearly seen below. The green line (the inner edge of the convective envelope) moves into the red line. This mixes C-12 to the surface (more on this later) and it also pushes inward the H/He discontinuity. Hence when the H-shell is re-ignited it does so at a smaller mass-value than before. The depth of the dredge-up typically grows with each pulse. This depth is measure by the "dredge-up parameter lambda", to be discussed below.
Anatomy of a Thermal Pulse
- We will now look at one pulse in more detail. We will then look at two consecutive pulses, to see how they interact and overlap.
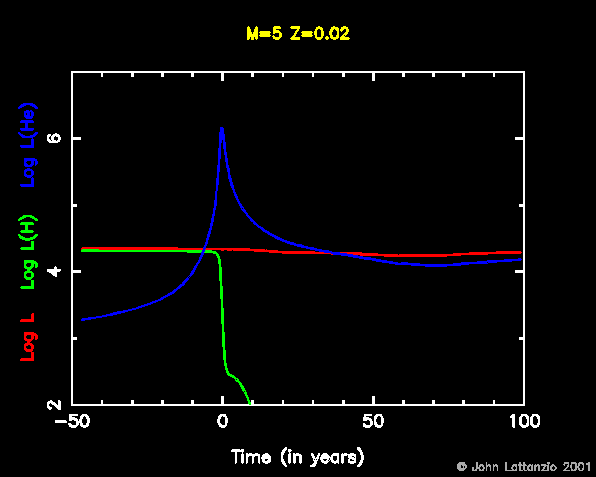
- Here is a close-up of the luminosity sources during the pulse.
Note that the time-scale for this picture is only 150 years. Once the He
luminosity becomes large, the H-shell is extinguished, and its output drops
to almost zero. The star acts as a luminosity thermostat, however, and the
total output from the surface is almost constant!
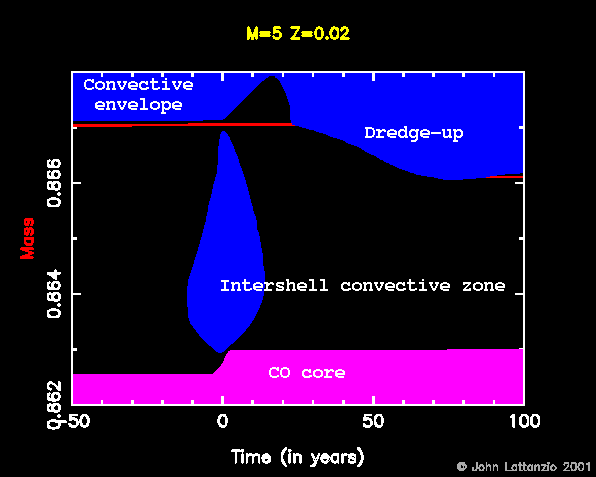
 On the same scale, we show next the important mass boundaries in
the star. Convective regions are shown in blue: these are the convective
envelope and the inter shell convective zone. When the He-shell "flashes"
it dumps more energy than can be carried by radiation, and a convective
zone develops. The abundance in this convective zone reflects the products
of the He burning reactions its about 25% C-12 and 75% He-4. This material
is pushed almost all the way to the H-shell. The large expansion caused by
the input of energy from the He-shell, now causes convection to grow inward
as the opacity rises at lower temperatures. This the convective envelope
reaches across the extinct H-shell and into what was the intershell
convective zone. Thus the convection, termed "dredge-up", succeeds in mixing
material to the surface that is enriched in C-12. There is much more
nucleosynthesis going on, and this will be discussed
later.
- This movie shows the HE profiles during the pulse. At the peak we see the flat profile corresponding to the rapid mixing in the convective zone. After the peak, the convective envelope moves inward and mixes up the freshly made He-4 to the surface. Note that the H0shell is extinguished prior to the dredge-up.
- Here we show the same He profiles ( horizontal and vertical ) together with the convective zones, for extra clarity.)
- This movie is similar, but it shows the C-profile as well as the He-4 profile. Obviously, C-12 is the product of He-4 burning, and this shows the production of C-12 and then its mixing to the surface by the third dredge-up.
- Here ( horizontal and vertical ) is the L profile during the pulse. This clearly shows the He-shell providing the energy as well as the expansion from the energy this produces.
- Here are the T profiles ( horizontal and vertical ) and the time-dependence of the temperature in the shells. We have picked one position for the H-shell in the second frame, but for the He-shell we have a typical point at the top, the middle and the bottom of the He-shell. Note how the lines cross-over! This is because there is a temperature inversion: the temperature is not monotonic through the He-shell during a pulse. You can see this clearly in the first frame which shows the T distribution vs mass.
- This is the same, but the second frame is the mass zones and convection is shown in red ( horizontal and vertical ). Likewise, radiative zones are shown in green on the first frame and convective zones are red, So as the grey line, indicating the current time, moves into a red zone (on the second frame) then the corresponding part of the T profile should also become red. This is a nice way of seeing the temperature of the intershell convective zone. As you can see, it reaches temperatures approaching 10^8.5K. One can also see the dredge-up, in red again.
- Here ( horizontal and vertical ) are the density profiles. Again, there is only one position shown for the H-shell, but three positions within the He-shell.
- And here ( horizontal and vertical ) are the radial positions of the same mass positions. The expansion is clearly visible here.
Two Consecutive Thermal Pulses
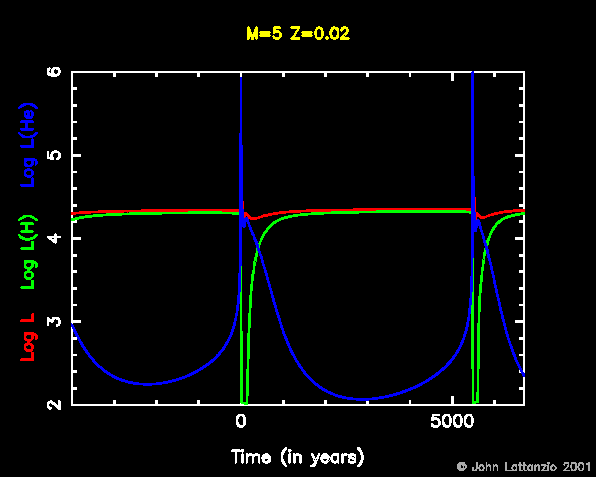
- Now we look at two consecutive thermal pulses. There is interesting interaction between them. This is especially important for the nucleosynthesis. Naturally, some of the ideas from above are repeated here.
- Here are the main luminosity sources: the H and He-shells.
Note that H powers the star throughout most of the evolution, with brief
bursts from He at the pulses. The sources alternate in importance, with H
providing most of the energy in time, but He catching up with short but
strong bursts! The surface value is hardly changed....
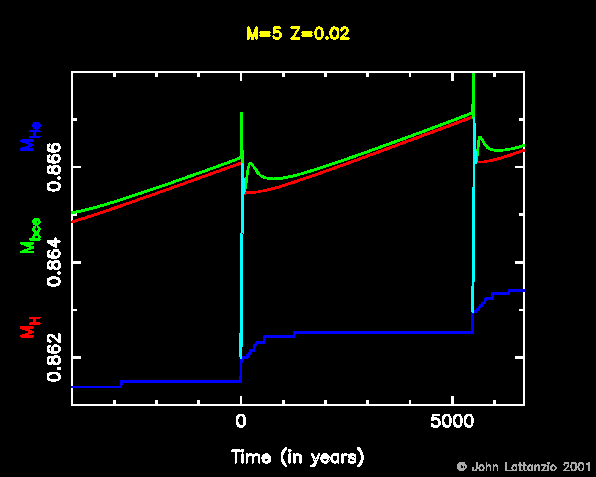
 The luminosity sources are reflected in the motion of the H- and
He-shells in mass, as shown below. The dredge-up is clearly seen. Note that
the intershell convective zones are just thin vertical lines on this scale.
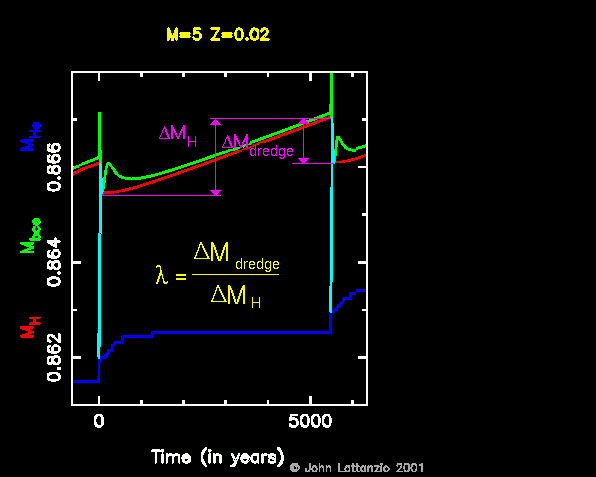
- An important parameter is the so-called dredge-up parameter, lambda. This is defined as the ratio between the amount of material dredged to the surface following a pulse, Delta M_dredge, and the amount of mass processed between two pulses by the H-shell, Delta M_H. This is shown below.
- Here ( horizontal and vertical ) are abundance profiles for He, C-12 and O-16. You can see the alternate advance of the H and He-shells, the intershell convection, and the dredge-up.
- Here are the L profiles ( horizontal and vertical )
- Here are the T profiles and shell values ( horizontal and vertical ) Note the temperature inversion during the pulse.
- Here is density profiles and shell values ( horizontal and vertical )
- Here are the radial positions vs mass, and the radial positions of the shells. Note how the H-shell is "flicked" outward by the He shell flashing. ( horizontal and vertical )
Return to the stellar evolution page.
Go to the nucleosynthesis page.