Emission of seismic transients during the impulsive phases of flares
is a complicated process. What is needed for a realistic understanding
of flare acoustic emission is careful radiative MHD modelling capable
of representing the profiles of chromospheric line emission during the
impulsive phases of flares, the entire active-region chromosphere,
photosphere and some distance into the underlying solar interior. A
realistic physics-based model of the relationship between the seismic
transient injected into the active region subphotosphere and the
observational signatures, both chromospheric-line and continuum, could
give us a magneto-helioseismic tool to probe magnetic subphotospheres.
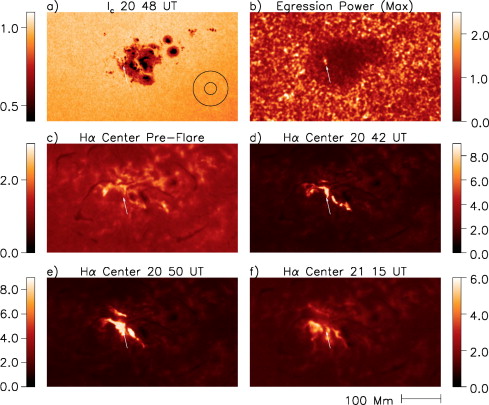
Acoustic emission during the impulsive phase of the flare of 2003 October 29 compared with excess Hα emission during and following the impulsive phase. Intensities are normalised to unity for the quiet Sun at disk center. (a) MDI continuum image of AR10486 at 20:48 UT. (b) Egression power image of AR10486 at seismic maximum phase, (impulsive phase, seeDonea and Lindsey, 2005), computed in a pupil of the dimensions indicated by the annulus in (a) centered on the focus. The arrow reproduced in all frames points to the seismic disturbance. (c) Pre-flare ISOON Hα (6562.8 Å) emission in a 0.1 Å passband centered on the line. (d) Line-center Hα emission in the impulsive phase of the flare. (e) Line-center Hα emission approximately 8 min after the impulsive phase. (f) Line-center Hα emission approximately 33 min after the impulsive phase. Hα signatures saturate at ∼9 times the mean quiet-Sun intensity at disk center. The times are indicated above the respective panels.
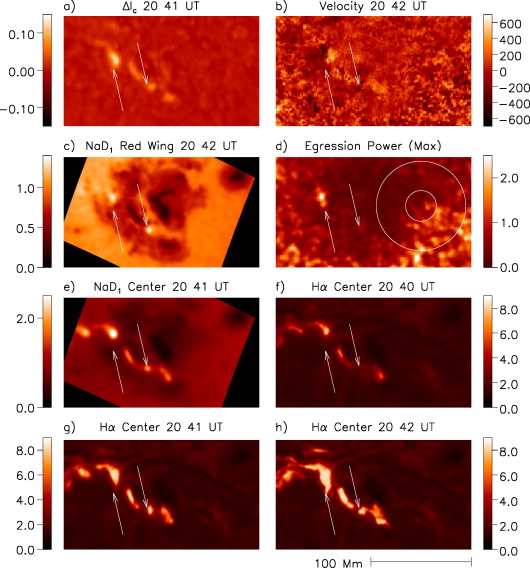
Co-spatial comparison of acoustic emission, Hα, NaD1-line and continuum emission, and Doppler disturbance in the impulsive phase of the flare of 2003 October 29. Intensities are normalised to unity for the quiet Sun at disk center. (a) Difference between two GONG continuum images taken a minute before and a minute after the time indicated above the panel. Left arrow appearing in all frames is reproduced from Fig. 1. (b) Transient downward Doppler disturbance (m/s) appearing in AR10486 during the impulsive phase of the flare. (c)Emission in the red wing of the NaD1-line, 0.14 Å from line center. Right arrow reproduced in all frames locates a compact transient downdraft during the impulsive phase of the flare. Egression power image of AR10486, reproduced from Fig. 1b. The annular pupil of the egression computation, reproduced from Fig. 1a, is now drawn at the right of this panel. (e) Impulsive-phase emission in the center of the NaD1-line. (f–h) Line center ISOON Hα images of AR10486 at 1-min intervals beginning at 20:40 UT. Times are indicated above respective panels.